L., ‘-
k
*.
c
L..
t
L
and
The best way to do this is to set up an array in memory. This is your “graph paper.” The first thing to do is to determine how big you want your output to be; this will determine the size of your array. (If you have grandiose plans to till an entire page with plotter output, you better have lots of memory in your computer. With 60 dots per inch horizontally and 72 dots per inch vertically, it takes at least 540 bytes of memory for each square inch of plotted area. That doesn’t sound so
Your array should be
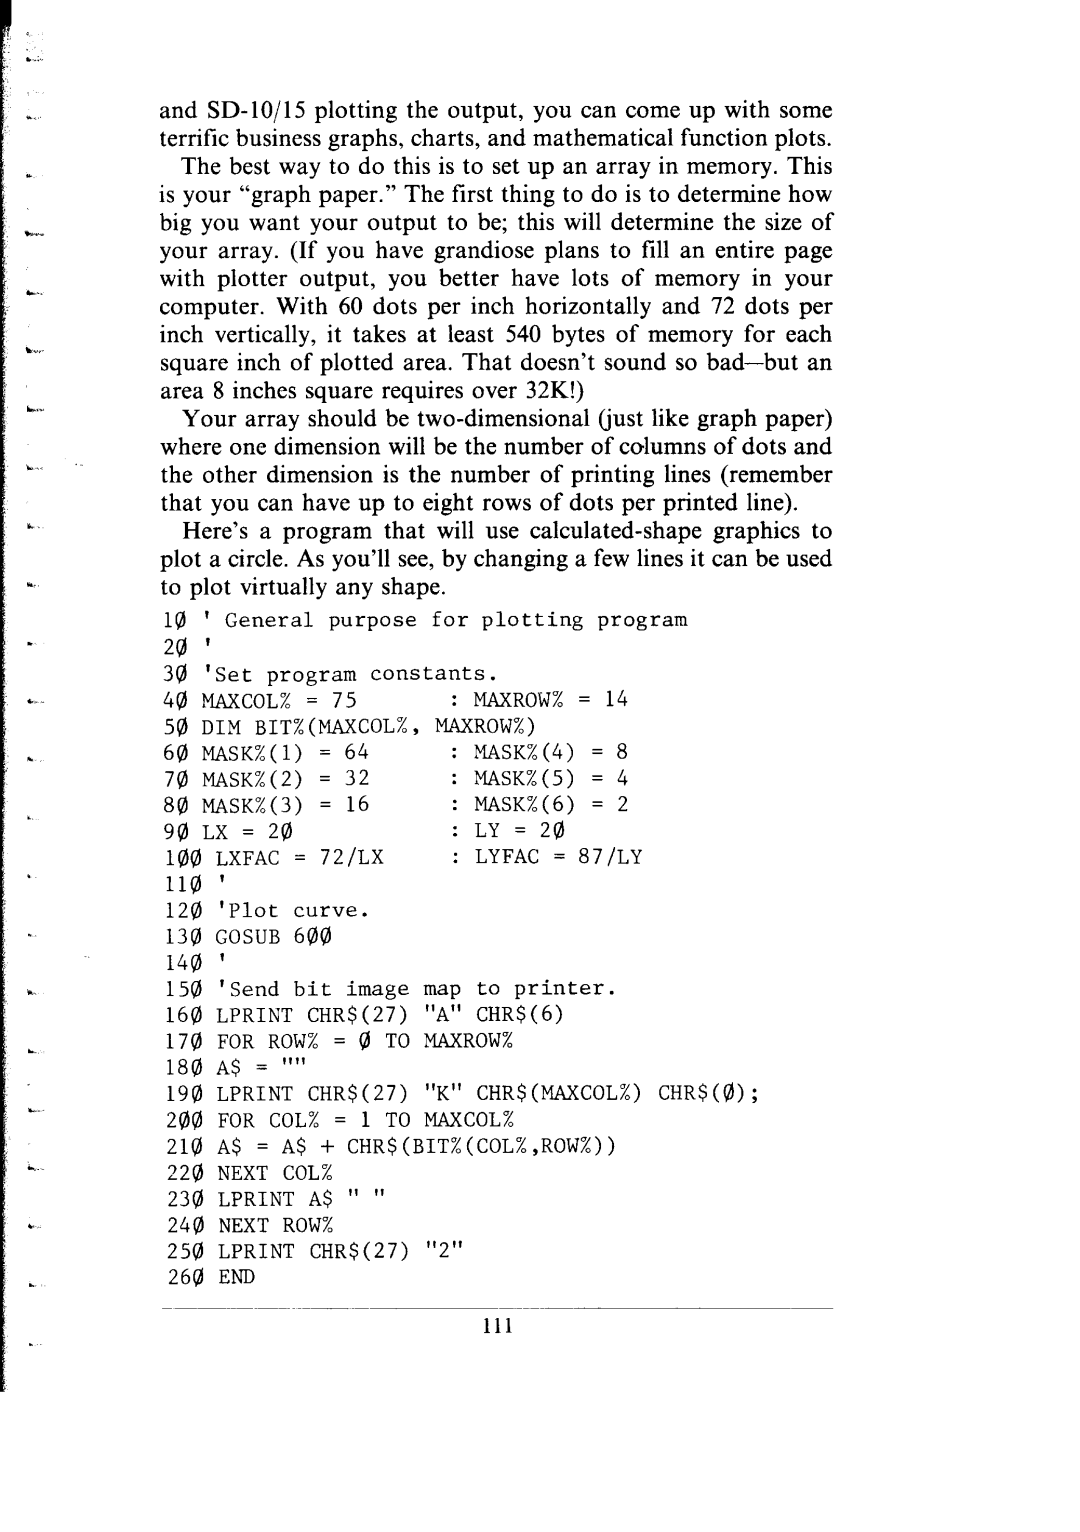
Here’s a program that will use
10' General purpose for plotting program
20 | ’ |
|
30 | 'Set program constants. | |
40 | MAXCOL% = 75 | : MAXROW% = 14 |
54)DIM BIT%(MAXCOL%, MAXROW%) | ||
60 | MASK%(l) = 64 | : MASK%(4) = 8 |
70 MASK%(2) = 32 | : MASK%(5) = 4 | |
80 | MASK%(3) = 16 | : MASK%(6) = 2 |
90 | LX = 20 | : LY = 24) |
100 LXFAC = 72/LX | : LYFAC = 87lLY | |
110 ' |
| |
120'Plot curve.
130GOSUB 600
144)'
150'Send bit image map to printer.
160LPRINT CHR$(27) "A" CHRS(6)
170FOR ROW% = $!TO MAXROW%
180A$ = ""
190LPRINT CHR$(27) "K" CHR$(MAXCOL%) CHR$(@); 209,FOR COL% = 1 TO MAXCOL%
2141A$ = A$ + CHR$(BIT%(COL%,ROW%>)
220NEXT COL%
230 LPRINT A$ " "
244)NEXT ROW%
250LPRINT CHR$(27) "2"
260 END
111