Using the 7C0x SmartSwitch Bridge View
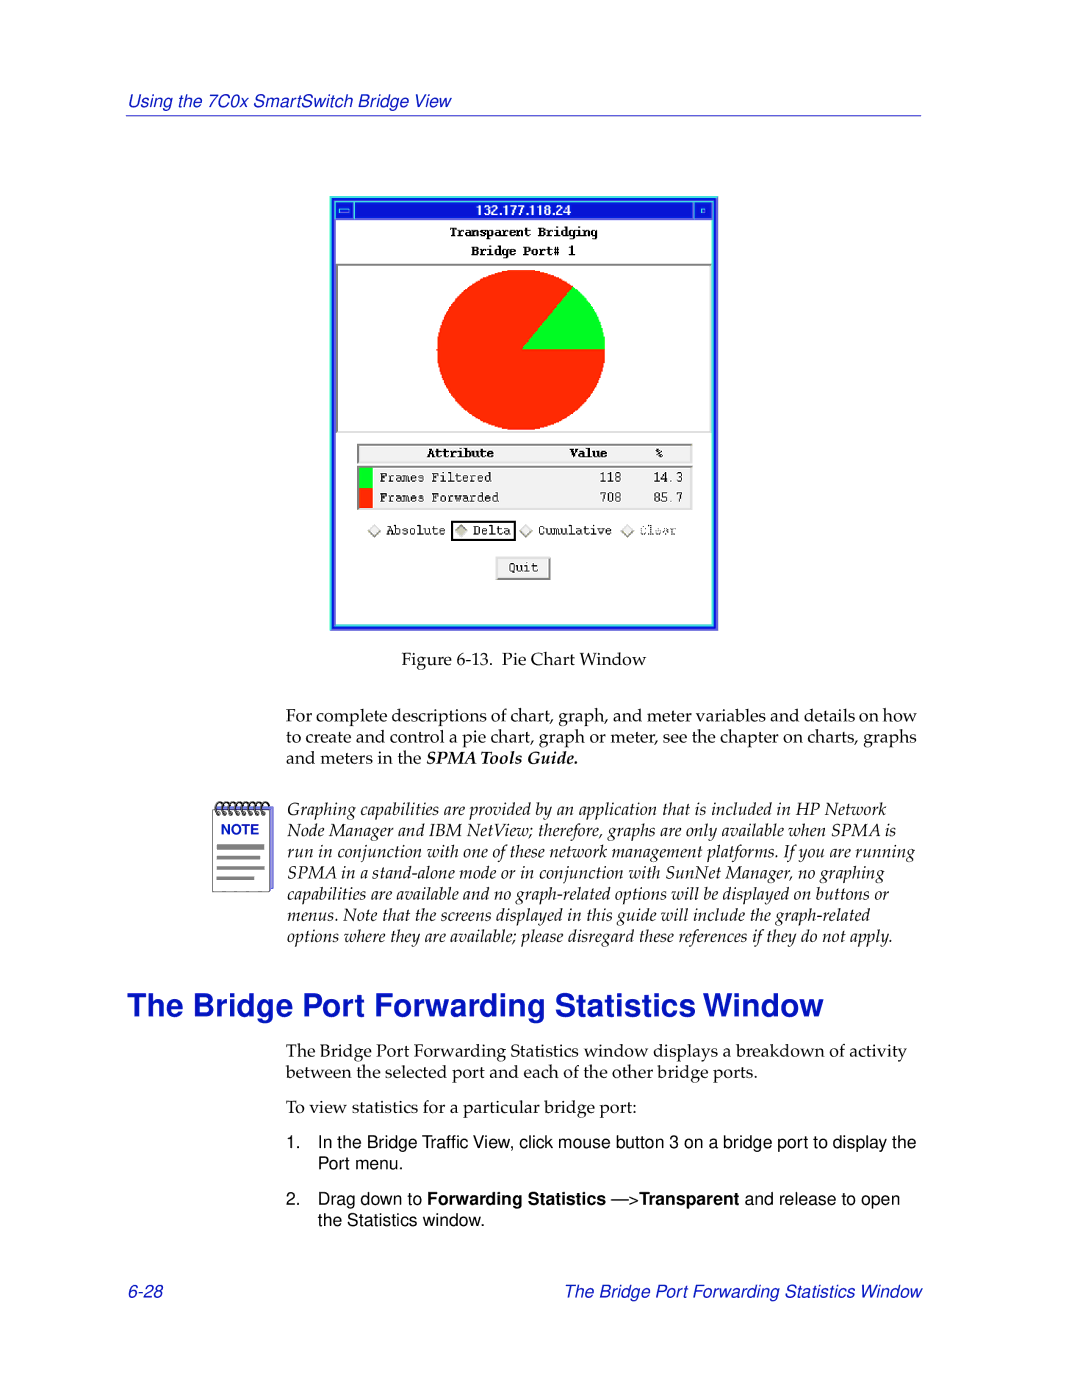
Figure 6-13. Pie Chart Window
For complete descriptions of chart, graph, and meter variables and details on how to create and control a pie chart, graph or meter, see the chapter on charts, graphs and meters in the SPMA Tools Guide.
NOTE |
Graphing capabilities are provided by an application that is included in HP Network Node Manager and IBM NetView; therefore, graphs are only available when SPMA is run in conjunction with one of these network management platforms. If you are running SPMA in a
The Bridge Port Forwarding Statistics Window
The Bridge Port Forwarding Statistics window displays a breakdown of activity between the selected port and each of the other bridge ports.
To view statistics for a particular bridge port:
1.In the Bridge Traffic View, click mouse button 3 on a bridge port to display the Port menu.
2.Drag down to Forwarding Statistics
The Bridge Port Forwarding Statistics Window |