Advanced Operations
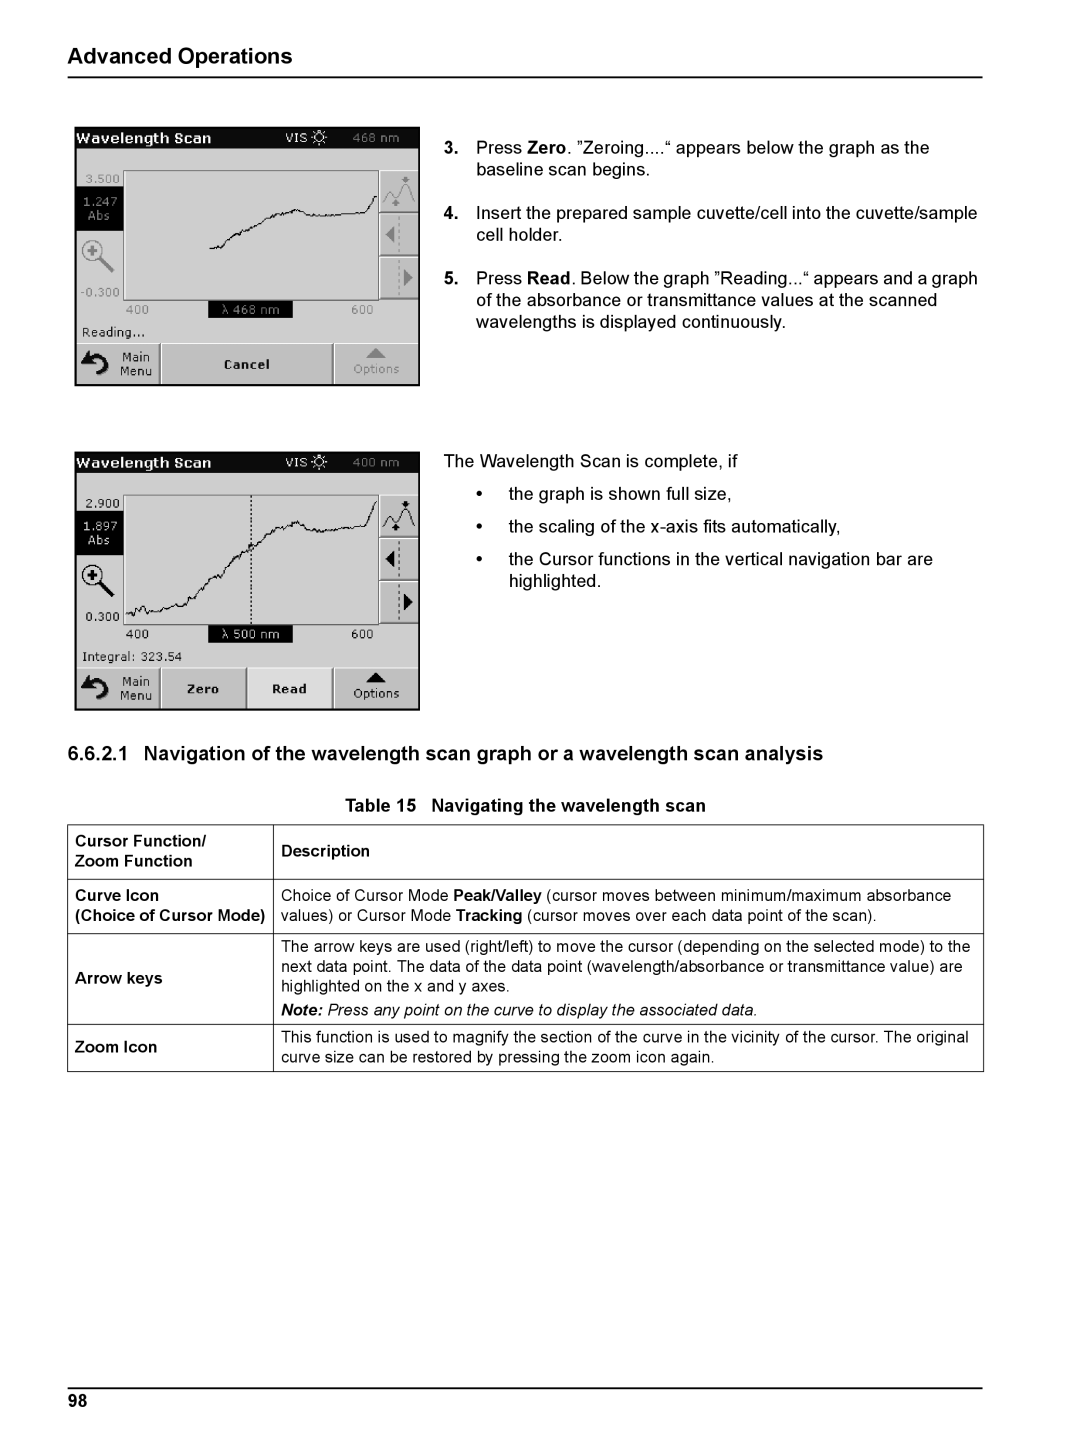
3.Press Zero. ”Zeroing....“ appears below the graph as the baseline scan begins.
4.Insert the prepared sample cuvette/cell into the cuvette/sample cell holder.
5.Press Read. Below the graph ”Reading...“ appears and a graph of the absorbance or transmittance values at the scanned wavelengths is displayed continuously.
The Wavelength Scan is complete, if
•the graph is shown full size,
•the scaling of the
•the Cursor functions in the vertical navigation bar are highlighted.
6.6.2.1Navigation of the wavelength scan graph or a wavelength scan analysis
| Table 15 Navigating the wavelength scan | |
|
| |
Cursor Function/ | Description | |
Zoom Function | ||
| ||
|
| |
Curve Icon | Choice of Cursor Mode Peak/Valley (cursor moves between minimum/maximum absorbance | |
(Choice of Cursor Mode) | values) or Cursor Mode Tracking (cursor moves over each data point of the scan). | |
|
| |
| The arrow keys are used (right/left) to move the cursor (depending on the selected mode) to the | |
Arrow keys | next data point. The data of the data point (wavelength/absorbance or transmittance value) are | |
highlighted on the x and y axes. | ||
| ||
| Note: Press any point on the curve to display the associated data. | |
Zoom Icon | This function is used to magnify the section of the curve in the vicinity of the cursor. The original | |
curve size can be restored by pressing the zoom icon again. | ||
| ||
|
|
98