Advanced Operations
6.7.3.1 Navigation of a time scan or a time scan analysis
After a time scan has been completed, the time and the absorbance/transmittance data are displayed as a curve.
Where the cursor is positioned on the curve, the elapsed time up to this point and the corresponding absorbance are highlighted.
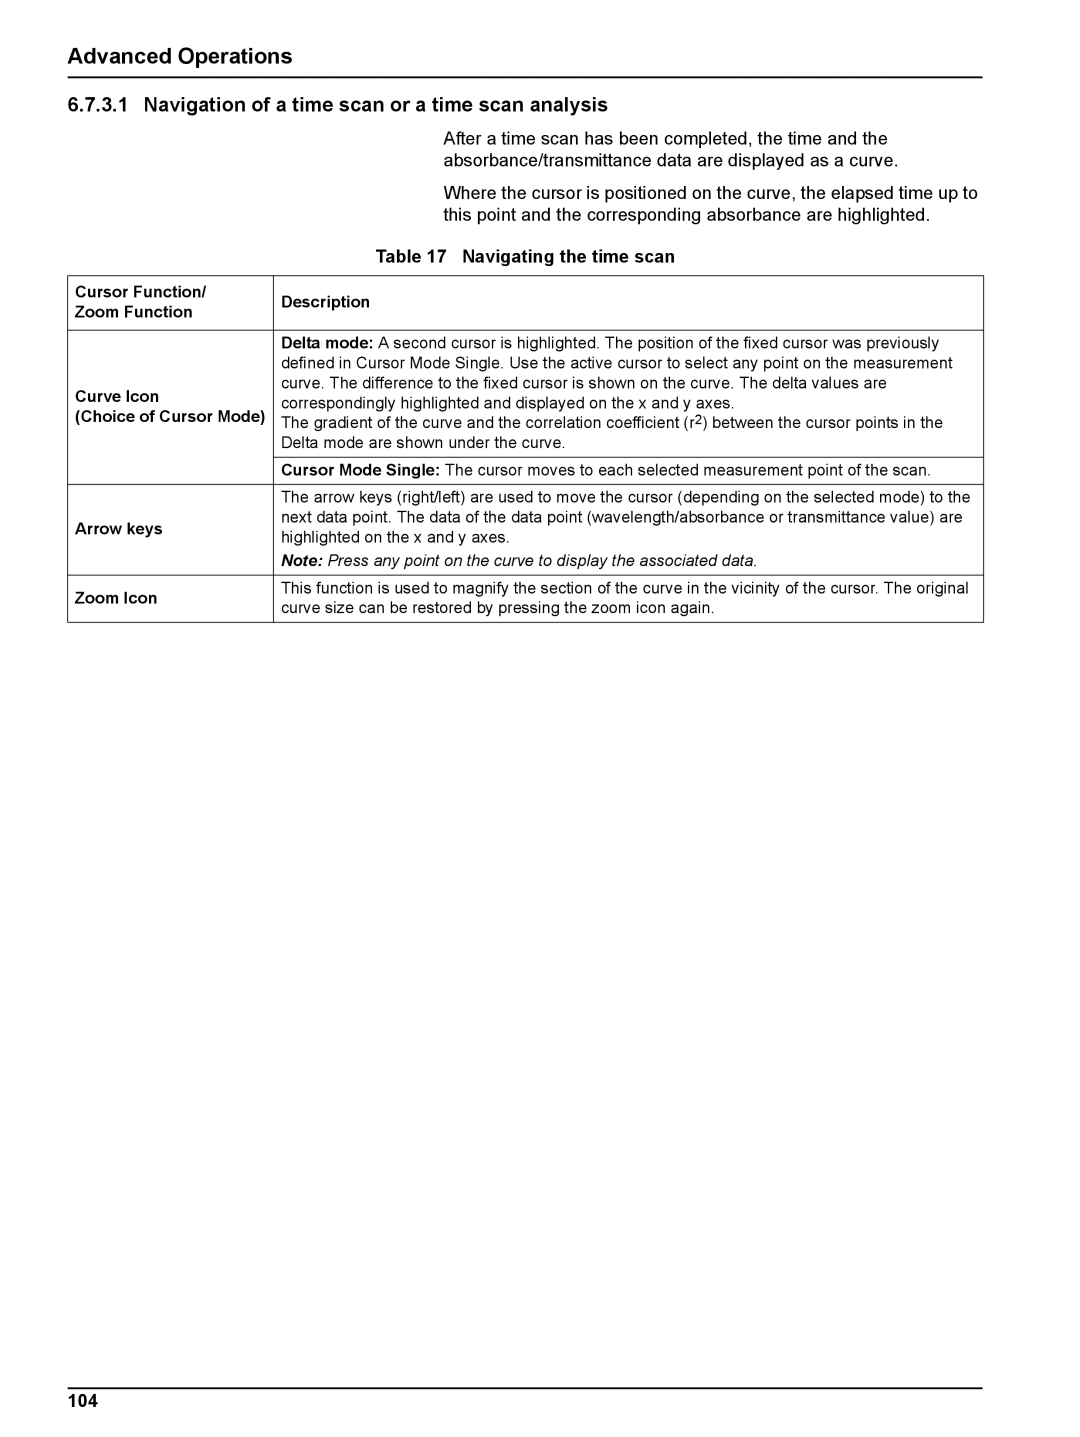
Table 17 Navigating the time scan
Cursor Function/ | Description | |
Zoom Function | ||
| ||
|
| |
| Delta mode: A second cursor is highlighted. The position of the fixed cursor was previously | |
| defined in Cursor Mode Single. Use the active cursor to select any point on the measurement | |
Curve Icon | curve. The difference to the fixed cursor is shown on the curve. The delta values are | |
correspondingly highlighted and displayed on the x and y axes. | ||
(Choice of Cursor Mode) | The gradient of the curve and the correlation coefficient (r2) between the cursor points in the | |
| Delta mode are shown under the curve. | |
|
| |
| Cursor Mode Single: The cursor moves to each selected measurement point of the scan. | |
|
| |
| The arrow keys (right/left) are used to move the cursor (depending on the selected mode) to the | |
Arrow keys | next data point. The data of the data point (wavelength/absorbance or transmittance value) are | |
highlighted on the x and y axes. | ||
| ||
| Note: Press any point on the curve to display the associated data. | |
|
| |
Zoom Icon | This function is used to magnify the section of the curve in the vicinity of the cursor. The original | |
curve size can be restored by pressing the zoom icon again. | ||
| ||
|
|
