Selecting Test Features
Using Pointer Graph Test Function
Using Pointer Graph Test Function
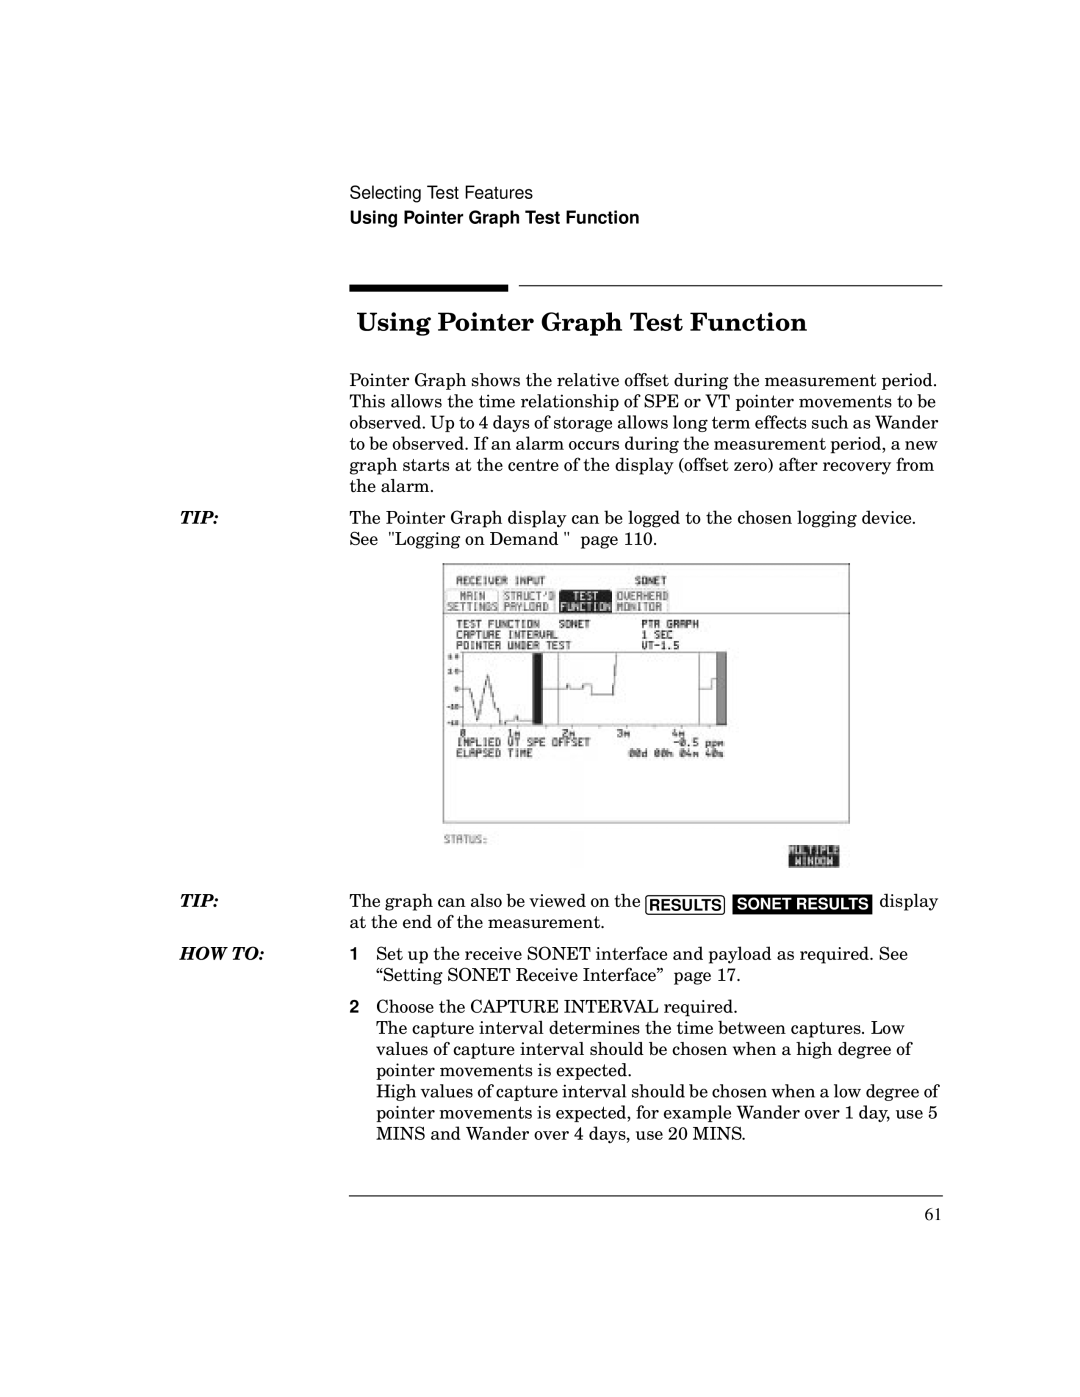
| Pointer Graph shows the relative offset during the measurement period. |
| This allows the time relationship of SPE or VT pointer movements to be |
| observed. Up to 4 days of storage allows long term effects such as Wander |
| to be observed. If an alarm occurs during the measurement period, a new |
| graph starts at the centre of the display (offset zero) after recovery from |
| the alarm. |
TIP: | The Pointer Graph display can be logged to the chosen logging device. |
| See "Logging on Demand " page 110. |
TIP: | The graph can also be viewed on the RESULTS | SONET RESULTS |
| at the end of the measurement. |
|
display
HOW TO: | 1 | Set up the receive SONET interface and payload as required. See |
|
| “Setting SONET Receive Interface” page 17. |
| 2 | Choose the CAPTURE INTERVAL required. |
|
| The capture interval determines the time between captures. Low |
values of capture interval should be chosen when a high degree of pointer movements is expected.
High values of capture interval should be chosen when a low degree of pointer movements is expected, for example Wander over 1 day, use 5 MINS and Wander over 4 days, use 20 MINS.
61