Software and Version
Revision/Update Information
Digital Equipment Corporation 199 7. All rights reserved
Contents
User Interface
Managing Load Hosts
Configuring LAT Characteristics
Vii
TCP/IP Network Characteristics
Managing AppleTalk
Configuring Basic Device Characteristics
Configuring Modem Signals
Configuring and Managing Interactive Devices
Xiii
Configuring and Managing LAT Services
Configuring LPD Printers
Configuring and Managing Slip Ports
Configuring for Snmp Access
Configuring and Managing 3270 Terminal Emulation TN3270
Configuring and Managing Point-to-Point Protocol PPP Ports
Managing IPX
Managing Dial Services
Managing Access Server Security
Xxiii
Accounting
Glossary Index
Page
Purpose
Using This Manual
Preface
Overview
Text
Conventions
Convention Meaning
Uppercase
Associated Documents
How to Order Additional Documentation
To Order Contact
Digital Equipment Corporation
FAX
Online Services
Correspondence
Documentation Comments
Page
Chapter Dnas Management
Introduction
This Chapter
Default Settings
Configuration Tasks for System Administrators
Configuration Tasks
To Configure Refer to
Management Tasks for System Administrators
System Management Tasks
To Manage Refer to
Accessing Online Help
User Tasks
Local Help Tutorial
Storage of Configuration Settings and Changes in Memory
Power Loss
Memory Types
Nvram
Commands to Display and Change Configuration Settings
Types of Commands That Operate on Configuration Settings
Reference
Chapter Management Tools
Access Server Commands
Levels of Access Server Commands
Command Provides Access to Commands to Enable Level Disable
Command Definitions
Command Result
User Groups
Local SET Server Privileged Password
Privileged Commands
Example Enabling Privileged Commands
Example Changing the Privileged Password
Help
Help Tutorial Command
Help Command
Example Accessing Online Help Information
Local Show Server
Example Show Server Command
Console Port
Displaying Port Parameters
Communications Utilities for Remote Console Sessions
Features of the Remote Console Port
Remote Console Port
Description
Network Control Program NCP
OpenVMS Utility Terminal Server Manager
Usage Considerations
Use of SET HOST/MOP from a DECnet/OSI OpenVMS Node
$ MCR NCP NCP Connect Node Shrimp Service Password Fedcba
Badcfe
Use of CCR from an Ultrix DECnet Node
Telnet Remote Console
CharacteristicDescription
Characteristics of the Telnet Remote Console Port
Access Server Manager
Functions
Related Information
Page
Chapter User Interface
Command Groups and Menus
Step Action
Using Command Groups
Creating a Command Group
Example Defining a Command Group
Executing a Command Group
Displaying a Command Group
Purging a Command Group
Example Show Menu Command
Using Menus
Displaying a List of Enabled Menus
Entering Menu Mode
Menu Windows
Assigning a Default Menu to a Port
Example Assigning a Default Menu
Local Define Port 2 Default Menu Hosts
Figure Windows on Access Server Menus
Local Change Menu Services from Main
Defining Menus
Main Menu
Defining Menu Choices
Main Menu Display
Example Sample Definition of a Menu Selection
Displaying a Selected Menu
Example Displaying a Menu Definition
Using Menus to Set Up a Captive Port
Exiting from a Menu
Displaying a Menu Definition
Example Commands to Purge Entire Menus and Menu Lines
Purging Menu Lines and Entire Menus
Local Purge Menu Main Line Local Purge Menu Hosts
Chapter Managing Load Hosts
∙ DSV$CONFIGURE ∙ Dsvconfig
Load Host Procedures
Backward Compatibility of DSV$CONFIGURE
Executing DSV$CONFIGURE
Defining Symbols
Server
ADD Command
Example Starting DSV$CONFIGURE and Displaying Help
Command Description Component
Modify and SET Commands
Delete Command
Example DSV$CONFIGURE ADD Command
Example List Command for DSV$CONFIGURE
List and Show Commands
Connect and USE Commands
Example Delete Command for DSV$CONFIGURE
Local CTRL/D
Local Show User
Context-Sensitive Help for DSV$CONFIGURE
Dsvconfig Menu
DECserver Configuration Procedure
IP Address Configuration Via Bootp
Using a BOOTP/TFTP Server
Remote Connection Password
Upline Dumps with BOOTP/TFTP Hosts
Upline Dumping
Upline Dumps with MOP Hosts
For TSM Users
Terminal Server Manager TSM
Page
Chapter Initializing the Access Server
Do This
Preparing LAT Services for Initialization
Preparing Telnet Listeners for Initialization
Disabled
Login Methods
Initializing the Access Server
Using the Initialize Command
Default Mode for the Initialize Command
Updating Flash RAM
Specifying an Image Name When Initializing
Specifying a Delay Value with Initialize
Specifying Initialization from a Load Host
Test Performs
Using the Diagnose Option with Initialize
Specifying the Disable Option with Initialize
Initialize Diagnose Option Tests
NCP Reference
Using NCP to Initialize the Access Server
NCP Initialization Commands
NCP Initialization Description Commands
Reference
Booting from the Network
Determining Boot Protocols
Loading the Software Image
Procedure
Booting Using Console Commands
Option Definition Associated Options
Boot Command Options
Option Definition Associated Options
Page
Chapter Configuring LAT Characteristics
Characteristic Default Range Refer to Section
LAT Characteristics
Preparing to Change LAT Characteristics
LAT Characteristic Summary
Queue Limit
Service Groups Enabled
Disabled
Passcheck
Displaying LAT Characteristics
Command To Use
LAT Characteristics Display Example
Configure Announcements Example
Announcements Characteristic
Decreasing the Circuit Timer
Circuit Timer Characteristic
Changing the Circuit Timer
Increasing the Circuit Timer
Removing an Identification String
Identification Characteristic
Identification String in a Login Procedure Display
Changing the Server Identification String
Local Change Server Keepalive
Keepalive Timer Characteristic
Keepalive Timer Default Values
Keepalive Timer Example
Local Change Server Multicast Timer
Multicast Timer Characteristic
Multicast Timer Default Values
Changing Multicast Timer Values Example
Local Change Server Name Printing
Access Server Name Characteristic
Default Access Server Name
Changing the Access Server Name
Node Limit Characteristic
Changing the Access Server Node Limit
Local Change Server Node Limit
Local Change Server Number
Access Server Number Characteristic
Access Server Number Values
Changing the Access Server Number
Local Change Server Passcheck Enabled
Passcheck Characteristic
Changing the Passcheck Characteristics
Passcheck Characteristic Example
Local Change Server Queue Limit None
Queue Limit Characteristic
Special Queue Limit Values
Changing the Queue Limit
Local Change Server Retransmit Limit
Retransmit Limit Characteristic
Changing the Retransmit Limit Characteristic
Retransmit Limit Values
Datagram Name Description
Responder Characteristic
Access Server Mapping
Datagram Types
Local Change Server Responder Enabled
Changing the Responder Characteristic
Changing Service Groups Examples
Service Groups
Viewing Service Groups
Changing Access Server Service Groups
Chapter TCP/IP Network Characteristics
TCP/IP Network Characteristics
Alternative Learning IP Information
Configuring the Internet Address and Subnet Mask
Setting the Internet Address
Tasks
Internet Address Class Default Subnet Mask
Setting an Internet Subnet Mask
Configuring the Internet Address and Subnet Mask
Displaying the Internet Address and Subnet Mask
Internet Address and Subnet Mask Display Example
Local Show Internet
Internet DNS Character Display Example
Configuring Domain Name System DNS Characteristics
Displaying DNS Characteristics
Local Show Internet Name Resolution
DNS
Field Description
Local Show Internet Name Resolution Counters
Displaying the DNS Counters
DNS Counter Display Example
Configuring and Using Default Name Resolution Domain Example
Configuring the Default Name Resolution Domain
Local Connect SALES.REVENUE
Using Trailing Dots
Changing the Retry Limit
Changing the Name Resolution Mode
Name Resolution Modes
Changing the Time Limit
Configuring a Root Name Server
Configuring a List of Commonly Used Internet Hosts
Configuring a List of Internet Name Servers
If Using a Name Server
Name Resolution and Gateways
Configuring a Name Server for a Different Domain
Pass Description
Assigning DNS Server Addresses Automatically
Displaying a List of Gateway Addresses
Configuring a List of Internet Gateway Addresses
Configuring a Default Gateway
Default Gateway Definition Example
Subnet Definition Through a Specific Gateway Example
Defining Networks Available Through a Specific Gateway
Defining Subnets Available Through a Specific Gateway
Defining Hosts Available Through a Specific Gateway
Sample List of Internet ARP Entries
Configuring a List of Internet ARP Entries
Displaying the List of Internet ARP Entries
Defining an ARP Entry
Disabling the Timer
Setting the TCP Keepalive Timer
What the Timer Does
Setting the Timer
Local Change Internet TCP Keepalive Retry
Displaying Timer Characteristics
Timer Characteristics Display
Retry Set Example
Local Show Internet Counters
Using the Show Command
Displaying the Internet Counters
Internet Counters Display Example
Bytes Data Retransmitted Total number
Internet Counter Display Fields
Field Description
24 TCP/IP Network Characteristics
Learning IP Information From a Bootp Server
Bootp Server Configuration
Learning Operation
Local Define Internet Address None
Setting Up IP Configuration Learning
Local Define Internet Enabled
Local List Internet
Bootp and Dhcp Differences
Using a Bootp Server Using a Dhcp Server
Learning IP Information From a Dhcp Server
Dhcp Client Operation
IP Address Assignment
Dhcp Proxy Operation
Enabling and Disabling Dhcp
Displaying the Dhcp Setting
Configuring Default Values
To Do This Use This Command
Operation
What Is Wins Autoconfigure?
Assigning Wins Server Addresses
What Does Wins Do?
Wins Display Example
Displaying Wins Characteristics
Assigning Wins Addresses
Wins Address Example
Field Description
Page
Chapter Managing AppleTalk Overview
Enabling AppleTalk
Configuring AppleTalk on an Access Server
Local Define Appletalk Enabled
AppleTalk Address Format
Local Define Appletalk address Cache size n
Setting AppleTalk Address Cache Size
Local Define Appletalk Disabled
Disabling AppleTalk
Configuring AppleTalk on an Access Server
Fields in the AppleTalk Characteristics Display
Displaying AppleTalk Characteristics
Commands
Displaying AppleTalk Characteristics Example
Fields in the AppleTalk Counters Display
Command
Displaying AppleTalk Counters
Displaying AppleTalk Counters Example
DDP
NBP
Rtmp
ZIP
Aarp Values
Field Value Description
Displaying AppleTalk Status
Displaying AppleTalk Status Example
Fields in the AppleTalk Status Display
AppleTalk is fully operational
Local Show Appletalk Routes
Displaying AppleTalk Routes
Displaying AppleTalk Routes Example
Fields in the AppleTalk Routes Display
Field Value Description
Local Show Appletalk ARP Entries
Displaying AppleTalk ARP Entries
Displaying AppleTalk ARP Entries Example
Fields in the AppleTalk ARP Display
Field Value Description
Page
Chapter Configuring Basic Device Characteristics
Configuring Basic Device Characteristics
Basic Device Characteristic Summary
Characteristic Default Allowed Refer to Values Section
Speed
Longbreak
Logout Longbreak Output Flow
Parity
Displaying Basic Device Characteristics
Displaying Port Characteristics Example
Local Show Port
Local Define Port 5 Access Remote
Configuring the Access Characteristic
Defining the Access Characteristic Example
Characteristic Device Type Examples
Matching the Port and Device Characteristics
Autobaud Settings
Setting For These Devices
Character Size Parity
Setting Check Performed Per Character
Example Changing the Parity Settings
Example Setting the Stop Bits for a Device
Example Changing the Port Speed
Local Change Port 5 Type Hardcopy
Device Types
Device Type Applies to
Example Changing the device Type
∙ XON/XOFF ∙ DSR ∙ CTS
Configuring the Flow Control Characteristic
When to Use
Flow Control Types
Example Enabling XON/XOFF Flow Control
Example Enabling DSR Flow Control
Example Enabling CTS Flow Control
Example Enabling output Flow Control
Flow Control Direction
Example Disabling Flow Control
Example Enabling Input Flow Control
Example Enabling Dsrlogout
Specifying the Automatic Logout Characteristics
Specifying Dsrlogout
Specifying Longbreak Logout
Example Enabling Inactivity Logout
Specifying the Inactivity Timer
Example Changing the Inactivity Timeout Period
Specifying Inactivity Logout
Chapter Configuring Modem Signals
Port Configuration
DTE/DCE Device Configuration
Network Access Server Modem Signals Supported Type
Determining the Supported Modem Signals
Access Servers and Modem Control
Access Server Types and Supported Modem Signals
Set
Modem Signals Description
Types of Modem Signal
Modem Signal Description
Dsrs
Specifying Modem Control and Signal Control
Logging Out the Port with Dsrlogout or Longbreak Logout
Computer Interface
Example Enabling Signal Control
Local Define Port 5 Modem Control Enabled Local Logout Port
Example Enabling Modem Control
Specifying Signal Select
Determining When to Use a Signal Set
Example Enabling Signal Select
Specifying Signal Check
Example Enabling Signal Check
Local Change Port 7 Signal Check Enabled
Local Change Port 3 Dtrwait Enabled
Specifying Dtrwait
Enabling Dtrwait Example
Specifying Ring
Specifying Alternate Speed
Specifying Dialup
Modem Control
Sample Modem Configurations
Configuring a Dial-In Modem on a Full Modem Control Server
Configuring a Dial-In Modem on a Modem Control Server
Configuring a Dial-Out Modem on a Full Modem Control Server
Configuring a Dial-Out Modem on a Modem Control Server
Establishing a Connection
Modem Control Sequences
Response to Momentary Loss of CTS
Disconnecting
Signal Control
Configuring DTR and DSR Signals
Port Characteristic Effects on the DTR and DSR Signals
Enabled Characteristic DTR and DSR Actions
Dtrwait
Dsrlogout Signal Control
Signal CHECK, Dtrwait
Check
For More Information
Chapter
∙ Managing Users ∙ Managing Sessions
Configuring an Interactive Device for LAT Sessions
Configuring an Interactive Device for LAT Sessions
Configuring LAT Group Codes for Interactive Devices
Sample Network Configuration
Local Change Port 5 Autoconnect Enabled
Specifying Autoconnect
Example Enabling Autoconnect
Example Disabling Autoprompt
Specifying the Default Protocol
Local Change Port 5 Autoprompt Disabled
Specifying Autoprompt
Example Enabling Queuing on a Port
Configuring Port Queuing
Specifying Failover
Example Disabling Port Failover
Option Displays Entries For
Displaying Access Server Queue Entries
Example Remove Queue
Removing Entries from the Access Server Queue
Show Queue ALL Display Example
Effect on the Queue
Local Change Port 5 Remote Modification Enabled
Configuring Port Characteristics
Configuring a Device on Port 6 for Internet Hosts Example
Configuring an Interactive Device for Telnet Sessions
Reference
Benefits and Restrictions Summary
Configuring a Session Management TD/SMP Terminal
How to Configure
Local Change Port 2 Multisessions Enabled
Command Descriptions
Local Mode Command Restrictions During Session Management
Logging In with Multisessions
Local Change Port 5 ON-DEMAND Loading Enabled
Configuring On-Demand Loading for Asian Terminals
On-Demand Loading Configuration Example
Disable Switch Character
Buffer Size
Configuring for Block-Mode Terminals
Profile Characteristics
Specifying the Telnet Client Session Profile
Profiles Types
Profiles
Session Character Binary Characteristics
Characters Terminal Type
Switch
Example Specifying Echo Characteristics
Modifying Telnet Session Characteristics
Specifying Echo Characteristics
Specifying the Binary Characteristic
Mapping Keyboard Characters to Telnet Functions
Specifying Character Size
Function Description Default
Telnet Keymapping Functions
Local Change Port 5 Telnet Client AO None
Example Disabling Autoflush
Specifying Autoflush
Specifying Autosynch
Specifying Telnet Client Newline
Examples Enabling Flow Control
Local Change Port 5 Telnet Client Flow Control Disabled
Specifying Flow Control
Example Specifying Telnet Client Newline
Specifying the Switch Character
Example Configuring Message Verification
Specifying Message Verification
Local Change Port Telenet Client Terminal VT321
Example Configuring Switch Character
Specifying a Preferred Terminal Type
Example Specifying Terminal Type
Managing Access Server User Accounts
Minimal Setup for Local User Accounts
Optional Setup for Local User Accounts
SHOW/LIST/MONITOR Useraccount Display
Authorization Profile Information
Service Type User Access
Service Types and Access Levels
Service Permissions Access
Service Type Description
Command Description Variables Comments Clause
User Account Command Parameters
Variable Definition
Access Command Variables
Providing a Contact Name and Access Server Location
Specifying Preferred Service for LAT or Telnet Resources
Managing Users
For the Telnet Protocol
Example Enabling a Preferred Telnet Service
Examples Configuring Port Username
Specifying the Port Username
Specifying Keys to Switch Between Sessions
Example Defining Keys as Switches
Local Change Port 5 Forward Switch F Backward Switch B
Defining the Break Key
Specifying a Key to Switch to Local Mode
Example Disabling Broadcast Messages
Example Configuring a Key as a Switch
Example Disabling a Local Switch
Specifying Broadcast
Specifying Loss Notification
Example Broadcast ALL
Example Disabling Loss Notification
Example Disabling Verification
Specifying Message Codes
Specifying Verification
Specifying Lock
Local Show Users
Example Configuring Lock
Displaying Information About the Users
Example Show Users Display
Specifying User Groups
SHOW/LIST/MONITOR Users Display Headings
Heading Description
Local SET Port Groups
Example Assigning User Groups
Initiating a Session to an Internet Host
Initiating a Session to a LAT Service
Example Initiating a Session to a LAT Service
Managing Sessions
Local Send Telnet AO
Sending Telnet Functions to a Remote Telnet Server
Example Initiating a Session with an Internet Host
Local Open Sales Local Telnet Sales
Local Change Port 5 Session Limit
Controlling the Number of Sessions
Example Changing the Server Session Limit
Local Change Server Session Limit
Displaying Session Information
Example Show Sessions Display
Local Show Sessions Port 1,2
SHOW/MONITOR Sessions Display Fields
Local Show Port 14 Session 1 Status
Displaying Session Characteristics
Local Show Port 4 Sessions 1 Characteristics
Displaying Session Status
SHOW/MONITOR Port Sessions Status Display Fields
Flow Control commands to enable
Terminating Sessions
Page
Prerequisites
Chapter Configuring and Managing LAT Services
Configuration Parameters
Configuring a Port to Offer a LAT Service
Configuring Access to a LAT Service
Assigning a Service Name
Enabling Announcements
Port Naming Guidelines
Assigning an Identification String
Assigning a Port Name
Example Clearing the Identification String
Example Clearing the Service Password
Specifying the Service Password
Password Limit
Example Assigning a Service Password
Example Configuring a PC As a Terminal and LAT Service
Configuration of Specific Types of Devices As LAT Services
Configuring a Computer As a LAT Service
Example Configuring a Computer As a LAT Service on Port
Local Define Port 2 Dedicated None Dialup Enabled Dsrlogout
Example Configuring a Dial-In and Dial-Out Modem
Configuring a Modem As a LAT Service
Privileges for Running Latcp
Configuring a Printer As a LAT Service
Setting Up a LAT Remote Print Queue on an OpenVMS Host
Example Configuring a Printer As a LAT Service on Port
LTLOAD.COM
Creating a Logical Device to Access a Printer Service
Configuring a Logical Device to Connect a Specific Port
Using a Remote Printer Command File
Setting Up a LAT Remote Print Queue on an Ultrix System
Configuration of Specific Types of Devices As LAT Services
Configuring a Printer with Unannounced Availability
Configuring a Printer with Unannounced Availability
More Examples
Local Connect LAT Adevice Destination PORT5
Verifying the LAT Service
Problem Solving
Example Verifying the LAT Service
Displaying Services Characteristics
Displaying Information About a Service
Example Show Service Characteristics Display
SHOW/LIST/MONITOR Service Characteristics Display Fields
Local Show Service Printer Characteristics
Displaying Services Status
Example Show Service Status Display
SHOW/LIST/MONITOR Service Status Display Headings
Local Show Service Develop Status
Displaying Services Summary
Example Show Service Summary Display
SHOW/LIST/MONITOR Service Summary Display Headings
Local Show Services ALL Summary
Page
Chapter Configuring and Managing Telnet Servers
Local Define Port 4 Dedicated None Dsrlogout Disabled Flow
Sample Device Configurations
Configuring a Printer for Access Through a Telnet Listener
Local Define Port 4 Access Remote Autobaud Disabled Break
Example Configuring a Dial-Out Modem
Configuring a Computer for Access Through a Telnet Listener
Configuring a Modem for Access Through a Telnet Listener
Sample Device Configurations
890-1234 Local Change Telnet
Sample Configuration
Configuring Personal Computer Access to a Printer
Switching Modes
Local Change Port 5 Interrupts Enabled Break Local
Setting User Priority for Devices Using Dynamic Access
Partner Guidelines
Configuring a File Transfer Partner
Characteristic Setting
Configuring a Remote Print Queue
Configuring a TCP/IP Remote Print Queue on an Ultrix System
Printer Port Telnet Server Characteristics
# lprsetup
Configuring a TCP/IP Remote Print Queue on a Unix System
Configuring a Telnet Listener
Event Indication Description
Configuring Telnet Server Session Characteristics
Mapping Event Indications to Keyboard Characters
Event Indications
Local Change Port 5 Telnet Server Character
Specifying Newline Characteristics
Local Change Port 5 Telnet Server Transmit Character Size
Example Setting Character Size in a Specific Direction
Displaying Telnet Listeners
Managing Your Access Server As a Telnet Listener Node
Displaying Telnet Server Characteristics
Example Show Port Telnet Server Characteristics Display
Removing a Telnet Listener
Removing One of Many Devices Assigned to a Telnet Listener
Example Removing a Telnet Listener
Reassigning a Port
Example TCP Messages to Poll Client User Location Data
Supplying User Location Data to Telnet Servers
Example Configuring Raw TCP
Configuring a Raw TCP Listener
When To Use Raw TCP
Configuring Raw TCP
Example Raw TCP Display
Displaying Raw TCP Characteristics
Chapter Configuring LPD Printers
This File Contains
LPD Operation
Supported File Types
Control and Data Files
LPD Operation
Operation
If Printing From Then This Host
Configuring LPD
Configuring Remote Hosts
Associating a Printer With a Port
Characteristic Description
Setting Port Characteristics
Local Show Printer ALL
Printer Configuration Example
Displaying Printer Characteristics
Printer Display Example
Speedy
Local Show Printer Speedy Status
Chapter Configuring and Managing Slip Ports
Configuring and Managing Slip Ports
Packet Forwarding to and from Slip Hosts
Network Configuration Containing Slip Hosts
Displaying Slip Characteristics
Displaying Slip Characteristics Example
Local Show Port 5 Slip Characteristics
Local Change Port Slip Host Address
Managing Internet Addresses for Slip Hosts
Assigning a Host Internet Address
Radius Specified Slip Host Address
How a Port Automatically Obtains the Slip Host Address
Fragmentation
Managing the Maximum Transmission Unit
Changing the MTU
Relationship of the TCP Maximum Segment Size and the MTU
Define Port Default Protocol Slip Dsrlogout Enabled
Example Configuring a PC As a Terminal and Slip Host
Configuring a Device As a Dedicated Slip Host
Configuring a Dedicated Slip Port
Configuring a Dial-In Modem for Use with a Slip Host
Prerequisites
Establishing Terminal Sessions with a PC
Establishing a Slip Session
Enabling a Slip Session from the PC
After Making a Connection
Automatic Cslip
Compressed Slip
Enabling Cslip
Disabling Cslip
Local Show Port 5 Slip Counters
Displaying Slip Counters
Show Port Slip Counters Display
Slip Counters Display Fields
Disable Slip Example
Local Change Port 2 Slip Disabled
Disabling Slip
Page
Chapter Configuring for Snmp Access
Supported Snmp Operations
Supported Snmp Features
Supported Specifications
Snmp Community Names
Supported MIBs
Supported MIB Variables
MIB Description
Supported Management Information Base Variables
Displaying Information About Snmp
Configuring the Access Server for Snmp Access
Default Community Name Public
Enabling and Disabling Snmp
One IP Address for a Community Name
Configuring a Community Name for Access by Any NMS
Configuring a Community Name with an Address
Example Configuring Community Names for Access by Any NMS
Configuring Community Names to Send Trap Messages
Example Configuring Snmp Trap Messages
This Event Occurs When
Removing Community Names
Sample Snmp Configuration
Local Clear Snmp Community Server Trap Disabled
Disabling Trap Messages for a Community Name
Local Change Snmp Community Server Address ANY
Removing an Address from a Community Name
Example Removing the Community Name Internet Address
Local Clear Snmp Community Bugs
Configuring the NMS
Chapter Managing the Access Server
Checking LAT Service Accessibility
Managing Your Access Server As Part of the LAT Network
Distributing Devices on Access Servers
Controlling the Number of Known Service Nodes
Local Show Node Peach Status
Reducing Memory Usage
Viewing LAT Node Status Information
Example Show Node Status Display
SHOW/LIST/MONITOR Node Status Display Fields
Viewing LAT Node Counters Information
Example SHOW/LIST/MONITOR Node Counters Display
TSHOW/LIST/MONITOR Node Counters Display Fields
Local Show Node Peach Counters
Field Description
Ports with Limited View
Viewing LAT Node Summary Information
Example Node Summary Display
Node Summary Display Fields
Local Show Node ALL Summary
Local Change Server Prompt Engineering
Displaying Information About the Access Server
Displaying Access Server Counters
Specifying the Prompt
Local Show Server Counters
Example Show Server Counters Display
SHOW/LIST/MONITOR Server Counters Display Fields
Ethernet Data Link Counters
Field Description
Field Description
Field Description
LAT protocol Counters
Displaying Access Server Status
Example Show Server Status Display
Local Show Server Status
MOP
Field Description
Memory used for storing service and node
Field Description
Field Description
Displaying Access Server Summary Information
Example Show Server Summary Display
SHOW/LIST/MONITOR Server Summary Display Fields
Local Show Server Summary
Checking Port Status and Counters
Displaying Port Characteristics
Example Show Port Characteristics Display
Local Show Port 1 Characteristics
Displaying Port Counters
Example Show Port Counters Display
SHOW/MONITOR Port Counters Display Fields
Local Show Port 1 Counters
Local Show Port 1 Status
Displaying Port Status
Example Show Port Status Display
SHOW/MONITOR Port Status Display Fields
Field Description
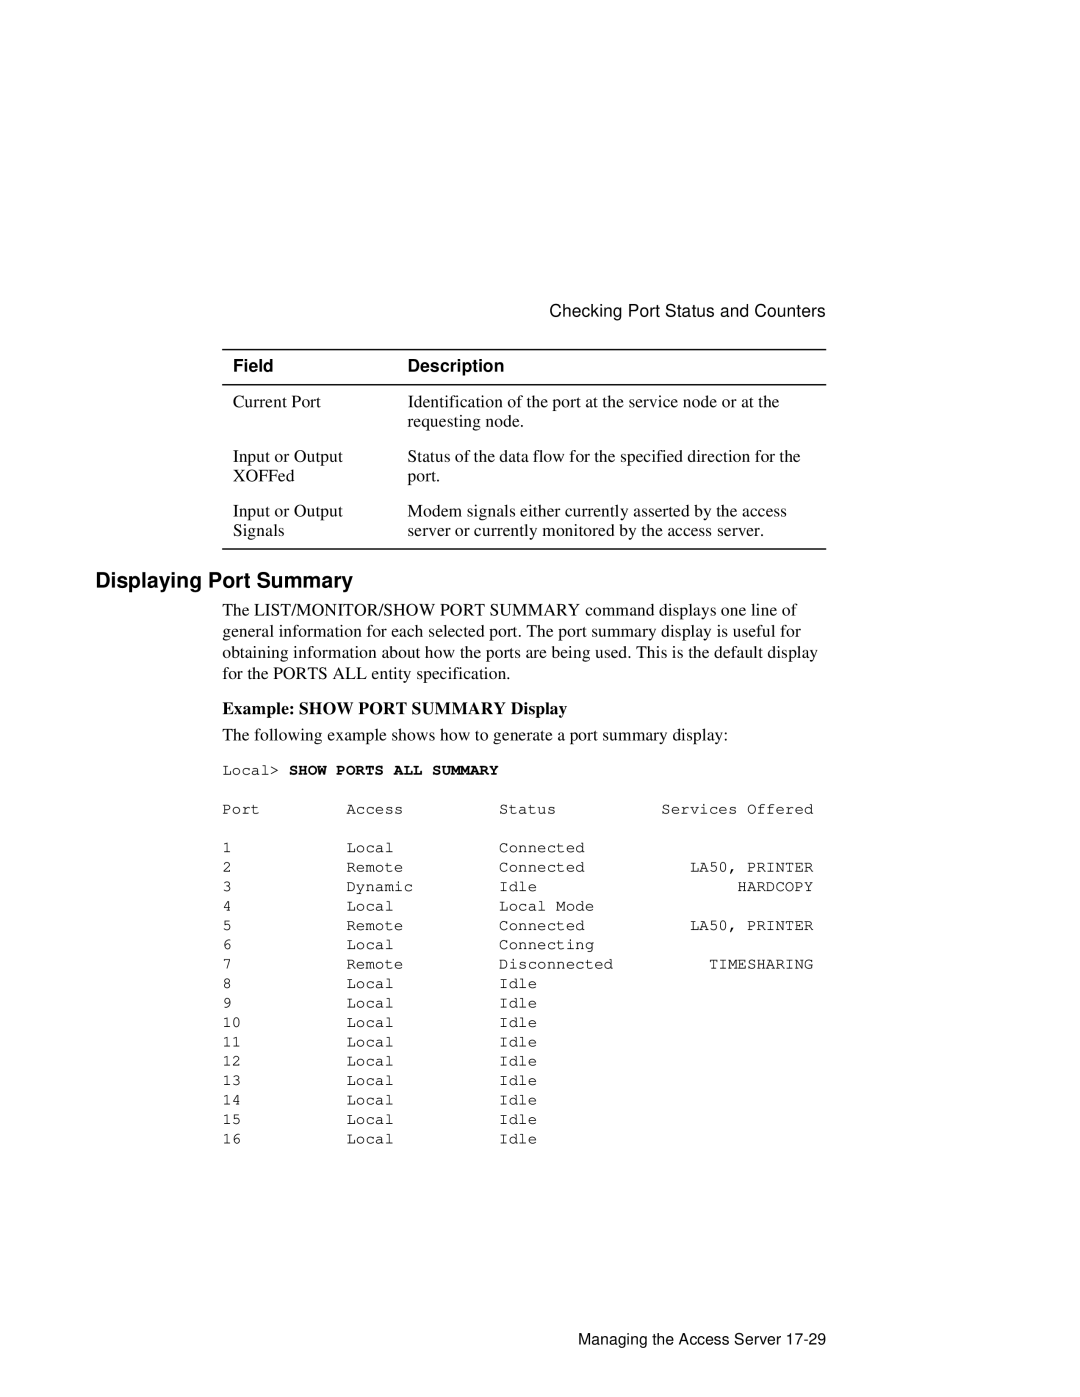
Displaying Port Summary
Example Show Port Summary Display
Local Show Ports ALL Summary
SHOW/LIST/MONITOR Port Summary Display Fields
Configuring and Managing 3270 Terminal Emulation TN3270
Definition
Supported Ascii Terminals
Definition and Description of a Keyboard Map
Keyboards
Server-Specific Keyboard Maps
Setting Up an Ascii Terminal
Configuring Basic 3270 Terminal Emulation
Specifying the Type of Ascii Terminal Used for Emulation
Terminal Setup Parameters
Terminal Model Setup Parameters
Indicating the 3270 Model Number
Entering and Editing Data
Connecting to an IBM Host
Status Line Indicator
IBM Host Communications
Message Description
Status Line Messages
Status Line Indicator Display
Local Show TN3270 Terminal
Default Server-Wide Terminal Types and Keyboard Maps
Displaying and Customizing Keyboard Maps
Server-Wide Keyboard Maps Customization
Local Show TN3270 Keymap VT220
Default Server-Wide Terminal Type and Keyboard Maps
Predefined Terminal Type Default Keyboard Map
Defining New Server-Wide Terminal Types and Keyboard Maps
Local Change TN3270 Keymap Newkeys Clear CTRL/W
Customizing Server-Wide Keyboard Maps
Rules for Customizing Keyboard Maps
Local Change TN3270 Terminal PC100DCA Keymap Newkeys
Local Show TN3270 Terminal
VT100, Ansi
Selecting and Customizing Keyboard Maps for a Port
Keyboard Map and Terminal Type
Predefined Terminal Device Associated Keyboard Map
Customizing a Default Keyboard Map for a Port
Local Change Port 2 TN3270 Terminal VT420
Local Change Port TN3270 Keymap Newline Ctrl/J
Following example shows a partial display of a keymap
Example Show Port TN3270 Keymap Command
SHOW/SET TN3270 Etoa
Command Enables You to Display and Modify
ASCII-to-EBCDIC and EBCDIC-to-ASCII Translation Tables
SHOW/SET TN3270 Atoe
Storage Requirements for TN3270 Definitions in Nvram
TN3270 Commands That Free Nvram Space
Command Frees Nvram Space Used By
Guidelines for Managing the Use of Nvram for TN3270
Local Define Port TN3270 Nvram Limit
Limiting Nvram Usage
Commands to Manage TN3270 Terminal Emulation
TN3270 Access Server Characteristics
Command Description Default
Description Default
TN3270 Port Characteristics
Displays
Show Commands
Page
Configuring and Managing Point-to-Point Protocol PPP Ports
Enabling PPP on an Access Server Port
Enabling PPP for Mixed Traffic
Example Enabling PPP for Mixed Traffic
Enabling Ports with Modems for PPP
Enabling Dedicated PPP Traffic
Using the Connect PPP Command
Establishing and Ending a PPP Session
Local Connect PPP
Local Show Port 5 PPP LCP Characteristics
Displaying PPP Characteristics
Displaying LCP Characteristics
Example Displaying LCP Characteristics
Field Description Values Default
Fields in the LCP Characteristics Display
Displaying Ipcp Characteristics
Example Ipcp Characteristics Display
Ipcp Characteristics Display Fields
Ipcp
Field Description Values Default
Local Show Port 5 PPP Atcp Characteristics
Atcp Characteristics
Example Atcp Characteristics Display
Atcp Characteristics Display Field Values
Field Description Values Default
Local Show Port 5 PPP LCP Status
Displaying PPP Status
Displaying LCP Status
Example LCP Status Display
Fields in the LCP Status Display
Example Ipcp Status Display
Displaying Ipcp Status
Fields in the Ipcp Status Display
Displaying Atcp Status
Example Atcp Status Display
Local Show Port 5 PPP Atcp Status
Fields in the Atcp Status Display
Local Show Port 5 LCP Counters
Example Commands to Display LCP Counters
Displaying PPP Counters
Displaying LCP Counters
Fields in the LCP Counters Display
Displaying Ipcp Counters
Example Command to Display the Ipcp Counters
Fields in the Ipcp Counters Display
Local Show Port 5 Ipcp Counters
Displaying Atcp Counters
Example Command to Display the Atcp Counters
Fields in the Atcp Counters Display
Local Show Port 5 Atcp Counters
Field Description
Chapter Managing IPX
IPX Description
Access Server Configuration
Login Procedures
Getting Started
Checklist
References
Hardware and Software Requirements
Software Requirements
Hardware Requirements
Novell Utilities for Local Execution
Setting Up Your PC
PC Remote Access Software
Novell Workstation Software
Enabling IPX
Setting Up the Network Access Server
Configuring the Port for an Attached Device
Local Change IPX Internal ipx-net Local Change IPX Enabled
Configuring the Port for the Login Method
Configuring the Port for Login to the Local Prompt
Activating PPP
Configuring the Port Dedicated to PPP
Configuring the Port for PPP/IPXCP Data Link
Enabling PPP/PAP Password Authentication
Disabling PPP/PAP Password Authentication
Passwords
Local Change Port n LCP Authentication Disable
SHOW/MONITOR Port n Description
Summary of DECserver IPX Management Commands
Port PPP IPX Commands for LCP
Port n LCP
Display the values of the Ipxcp counters
Port PPP IPX Commands for Ipxcp
Port PPP Commands for PPP Negotiation Status
Port n Ipxcp
Server IPX Commands
Characteristics
Display the values of the PPP counters
Learn
SNAP802
Modem Considerations
Dial-In Modems
Dial-Out PC Modems
Recommended Serial Port Baud Rate
Novell Operation
Novell Client/Server Operation
Novell Client/Server Operation
Operational Checkout and Diagnosis
Verifying Configuration
Using the Define Command
Local Define IPX Disabled
Disabling IPX
SAP802
Frame Types
Standard Ethernet
RAW802
Local Show IPX Characteristics
Displaying IPX Characteristics
IPX Characteristics Display
IPX Characteristics Display Fields
Field Description
Fields in the IPX Status Display
Using the Show IPX Command
Displaying IPX Status
IPX Status Display
IPX Counters Display Fields
Use the Show IPX Counters command
Displaying IPX Counters
IPX Counters Display
Field Description
Field Description
IPX Routes Display Fields
Using the Show IPX Routes Command
Displaying IPX Routes
IPX Routes Display
Option Description
Resetting Counters
Using the Zero Command
Zero Command Options
Page
Chapter Managing Dial Services
Dial Services Command Groups
Command Groups
Entering the SET Privileged command
Server Configuration Display
Checking the Current Server Settings
Dialer String Descriptions
String Type Default Value Usage
Defining a Dialer Script
Defining Dialer Script Strings
Example Set Dialer Script Name
Assigning the Dialer Script to a Port
Steps
Determining the Current Dialer Script
Example Defining the Dialer Script
Example The Show Port Command Display
Dialer Script Generic14400 Preferred Service Callhome
Assigning a Dialer Script to a Port
Dialer Script Dickens
Verifying Dialer Script Configuration
Example Show New Port Configuration
Local Change Port 2 Dialer Script dickens Local Show Port
Showing the Current Dialer Service Characteristics
Defining the Dialer Service
Example Show Dialer Status
Showing Dialer Service Status
Example Show Dialer, Port Security Enabled
Local Show Dialer Attradeshow Characteristics
Show Dialer Status Display Fields
Status Meaning
Local Show Dialer Attradeshow Status
Attradeshow
Modifying the Dialer Service
Displaying Dialer Counters
Example Show Dialer Counters
Characteristic DescriptionComments
Dialer Service Characteristics
Characteristic Description Comments
User Account Characteristics
Mode Command Variables
Username
Mode
Security Profile Information
Configuring Interactive Dial Requests
Configuring for Interactive Dial-Back
Interactive Dial-Back Dial Service Example
Framed Dial Requests
Changing PPP Characteristics Examples
Configuring Dynamic Access
Configuring Call-Back
Framed Dial Requests
Page
∙ Radius
Chapter Managing Access Server Security
Realm Definition
Radius Authorization
Security Type Descriptions
Kerberos
SecurID
User Accounts
Stage Description
Common Terminology Across Security Realms
Security Server
UDP Ports
Radius Accounting
Configuration Prerequisites
Managing Kerberos
Kerberos Host Requirements
Case Sensitivity
Configuration of User Authentication
Network Access Server Requirements
Configuring Kerberos Settings
Example Definition of Kerberos Settings
Local show kerb characteristics
Displaying Kerberos Settings
Port Configuration
Example Sample Show Port Command
User Authentication Procedure
Example Authentication with a Complete User Name
Username smith.su@finance.acme.com Password not echoed
Alternative Password Command
Changing a User Name and Password
User Authentication Counters
Example Sample Kerberos User Authentication Session
Local Zero Server Authentication Counters
Port User Authentication Counters
Setting the User Authentication Counters to Zero
Local Show Port 1 Authentication Counters
Minimal Setup for Radius
Managing Radius
Variables
Local Change Radius Interval seconds
Optional Setup for Radius
Local Change Radius Timeout seconds
Example Including the Realm Name
Number
Radius User Authorizations
Example Defining Realm Default Authorization Attributes
Example Defining Password Authentication Type
User Access to the Access Server
Setting User Permissions
Value Description
Additional Radius Attributes
General Session Attributes
General Session Definition Attributes
Framed Session Attributes Definition
Framed Session Attributes
Interactive session Definition Attributes
Interactive Session Attributes
Digital Vendor-Specific Attributes
Radius General Non-Session Attributes
Radius Overhead Definition Attributes
Digital Vendor-Specific Attributes
Radius Accounting Definition Attributes
Radius Accounting Attributes
Radius
Optional Radius User Attributes
SecurID Ports
Using the Secret Keyword
Managing SecurID
SecurID Prompts
SecurID Realms
Minimal Setup for SecurID
Optional Setup for SecurID
Local Change Securid Timeout seconds
SecurID User Authorizations
Noprivileged level of Decserver
Local SET Server Realm JONAS.COM
Managing Local Access Server Security
Example Setting the Server Realm
Defining the Realm
Determining Security Configuration
Displaying RADIUS, SECURID, and Kerberos Characteristics
Example Showing Radius Characteristics
Example Showing the Server Realm
Example Showing SecurID
Example Displaying Kerberos Characteristics
Displaying Security Summary
Example Showing the Security Summary
Showing Security Counters
Showing the Authentication Counters
Showing the User Port Authorization Profile
Example Showing the User Port Authorization Profile
Activating Autolink
Example Configuring the Port
Authentication
Enabling Autolink Authentication
Specifying an Authentication Method
Example Enabling Autolink Authentication
Setting Autolink Timers
Example Setting Autolink Timers
Chap Username
Using a Login Script
Timeouts
LAT Protocol Requirement
Specifying Other Security Features
Specifying Dedicated Service for LAT or Telnet Resources
Kerberos Requirement
Local Change Port 5 Dedicated SALE.MKT.DEC.COM
Specifying Passwords
Local Change Port 5 Signal Control Enabled
Telnet Requirement
Local Change Port 5,6,7 Password Enabled
Specifying Password Limit
Login Password Definition Example
Local Change Server Login Password Total
Example Changing the Server Password Attempt Limit
Page
Accounting
Accounting Log File
Accounting Description
What Events Are Logged?
Contents of Log Entry Types
Event Field Descriptions
Above
Ping
Autolink
Local Access For nondedicated/preferred case, whatever you
Session Disconnect Event The number of bytes of successfully
When Events Are Logged
Password Modified Events
User Privilege Level Modified Events
Snmp Community Modified Events
Managing Accounting
Defining the Accounting Log Size
Example Defining the Accounting Log Size
Example Changing the Accounting Console
Changing the Accounting Threshold
Changing the Accounting Console
Example Changing the Accounting Threshold
Displaying Accounting Characteristics
Example Displaying Accounting Characteristics
Local Show Accounting Characteristics
Displaying the Accounting Log
Example Displaying the Accounting Log
Local Show Accounting LOG
LAT Remote View of the Accounting Log
Using the Accounting Console Logging Feature
# Telnet x.x.x.x 2001 ACCT.LOG
Example Telnet Remote View of the Accounting Log
57600
# Telnet x.x.x.x
Appendix a Cable and Adapter Recommendations
Cable and Adapter Hardware
Cable and Adapter Table
Cable and Adapter Recommendations
Glossary
American Standard Code for Information Interchange
Authentication
Authentication trap
Bootptab file
Broadcast
BOOTP/TFTP Server
Circuit timer
Command line recall and edit
Data Set Ready
Dedicated service
Cyclic Redundancy Check
Datagram
Downline loading
Dequeue
Domain names
Domain Name System
Gateway
Event logging
Failover
Flow control
Initialization
Installation Verification Procedure
Internet Bootstrap Protocol
Image
Kerberos
Keepalive timer
Internet Protocol
IP datagram
LAT network
LAT service
LAT architecture
LAT Control Program
Local name server
Local service
Maintenance Operation Protocol
Multicast timer
Network Control Program
Name resolution
Network access server
Name server
On-Demand Loading Font Protocol
Nonvolatile Random Access Memory
Preferred service
ODL Font Protocol
Qualifier
Random Access Memory
Print spooler
Privileged status
Remote print queue
Service
Service circuit-ID
Service node
Session management
Service rating
Service session
Session
Synchronous
Switch characters
Subnet identifier
Subnet mask
Time To Live
Terminal Device/Session Management Protocol
Terminal Server Manager
Terminal session
XON/XOFF characters
User Datagram Protocol
Virtual circuit
Wide Area Network
Index
Symbols
Internet Host 7-13 Telnet Listener
Broadcast
Delete
DSV$CONFIGURE 4-4,4-6
Telnet Listener
Cslip
Index-4
IBM
Index-6
Appletalk Characteristics 8-5 DSV$CONFIGURE
Index-8
Index-9
BOOTP/TFTP
Internet TCP Keepalive Retry
Session
Internet TCP Keepalive Timer 7-19 Port
Port Session Status 11-27 Queue ALL
Appletalk Status 8-5 Queue
AppleTalk ARP display 8-14 AppleTalk routes display
Index-14