108CHAPTER 12: REPORT TYPES
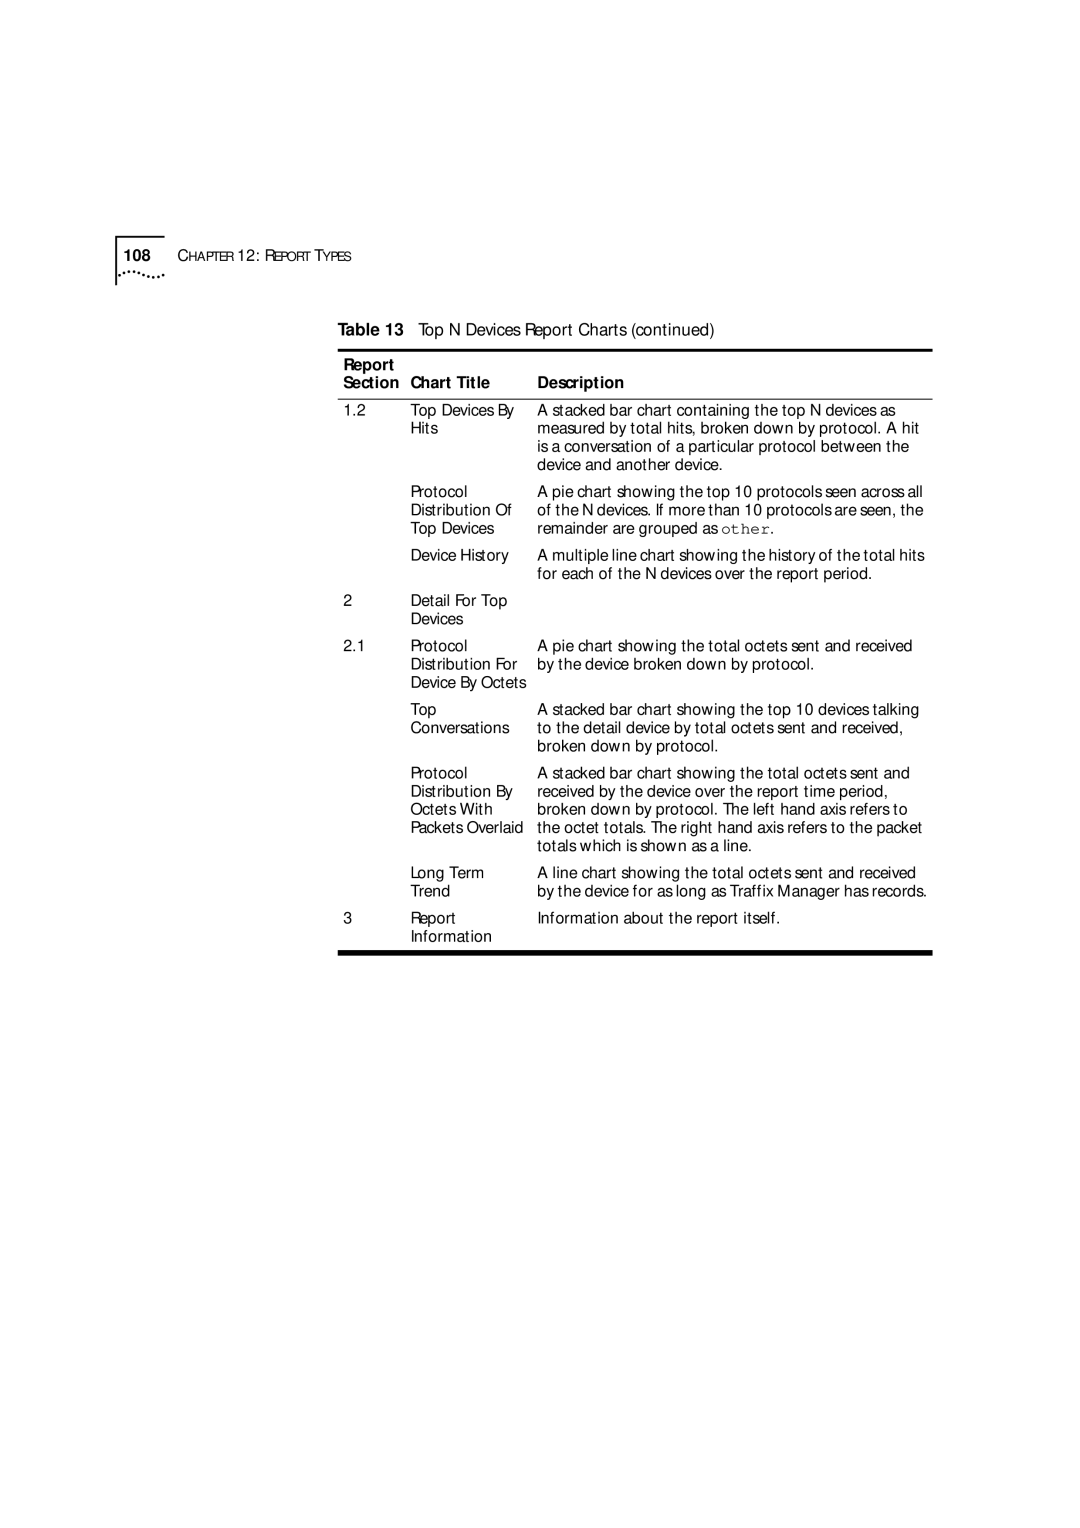
Table 13 Top N Devices Report Charts (continued)
Report | Chart Title | Description |
Section | ||
|
|
|
1.2 | Top Devices By | A stacked bar chart containing the top N devices as |
| Hits | measured by total hits, broken down by protocol. A hit |
|
| is a conversation of a particular protocol between the |
|
| device and another device. |
| Protocol | A pie chart showing the top 10 protocols seen across all |
| Distribution Of | of the N devices. If more than 10 protocols are seen, the |
| Top Devices | remainder are grouped as other. |
| Device History | A multiple line chart showing the history of the total hits |
|
| for each of the N devices over the report period. |
2Detail For Top Devices
2.1 | Protocol | A pie chart showing the total octets sent and received |
| Distribution For | by the device broken down by protocol. |
| Device By Octets |
|
| Top | A stacked bar chart showing the top 10 devices talking |
| Conversations | to the detail device by total octets sent and received, |
|
| broken down by protocol. |
| Protocol | A stacked bar chart showing the total octets sent and |
| Distribution By | received by the device over the report time period, |
| Octets With | broken down by protocol. The left hand axis refers to |
| Packets Overlaid | the octet totals. The right hand axis refers to the packet |
|
| totals which is shown as a line. |
| Long Term | A line chart showing the total octets sent and received |
| Trend | by the device for as long as Traffix Manager has records. |
3 | Report | Information about the report itself. |
| Information |
|
|
|
|