68CHAPTER 8: DISPLAYING TRAFFIC IN GRAPHS
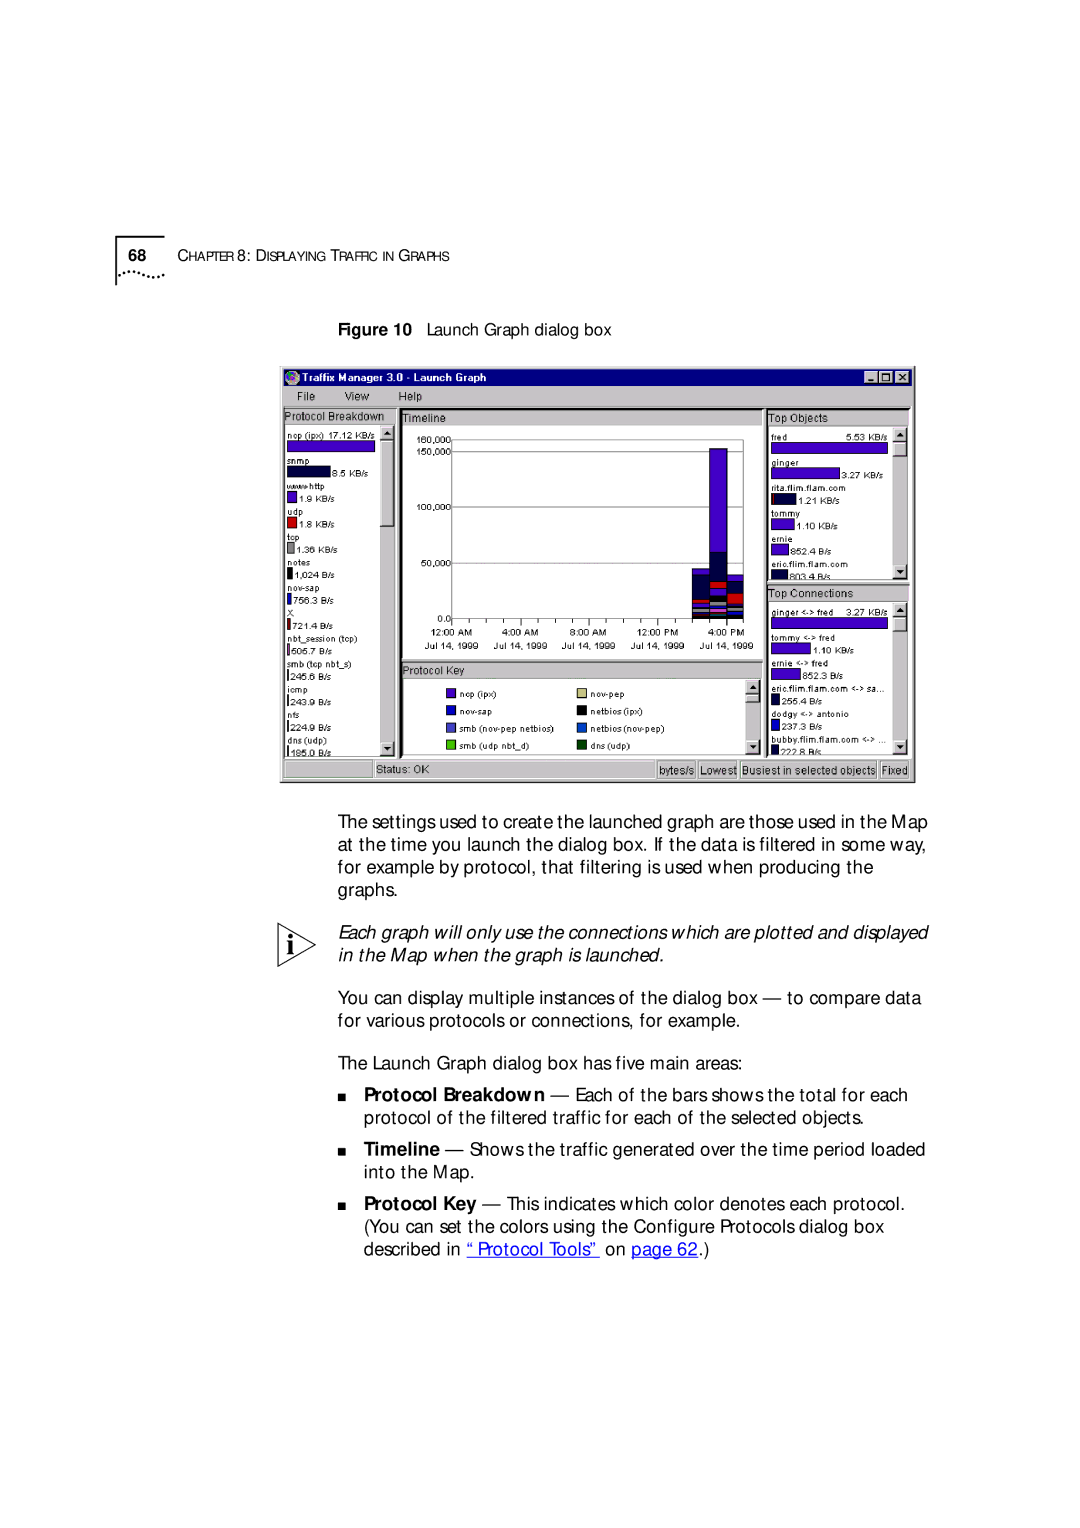
Figure 10 Launch Graph dialog box
The settings used to create the launched graph are those used in the Map at the time you launch the dialog box. If the data is filtered in some way, for example by protocol, that filtering is used when producing the graphs.
Each graph will only use the connections which are plotted and displayed in the Map when the graph is launched.
You can display multiple instances of the dialog box — to compare data for various protocols or connections, for example.
The Launch Graph dialog box has five main areas:
■Protocol Breakdown — Each of the bars shows the total for each protocol of the filtered traffic for each of the selected objects.
■Timeline — Shows the traffic generated over the time period loaded into the Map.
■Protocol Key — This indicates which color denotes each protocol. (You can set the colors using the Configure Protocols dialog box described in “Protocol Tools” on page 62.)