66CHAPTER 8: DISPLAYING TRAFFIC IN GRAPHS
Using the Graph | The Graph Panel of the main window shows basic information about the |
Panel | network activity of selected items in the Map as a number of graphs. |
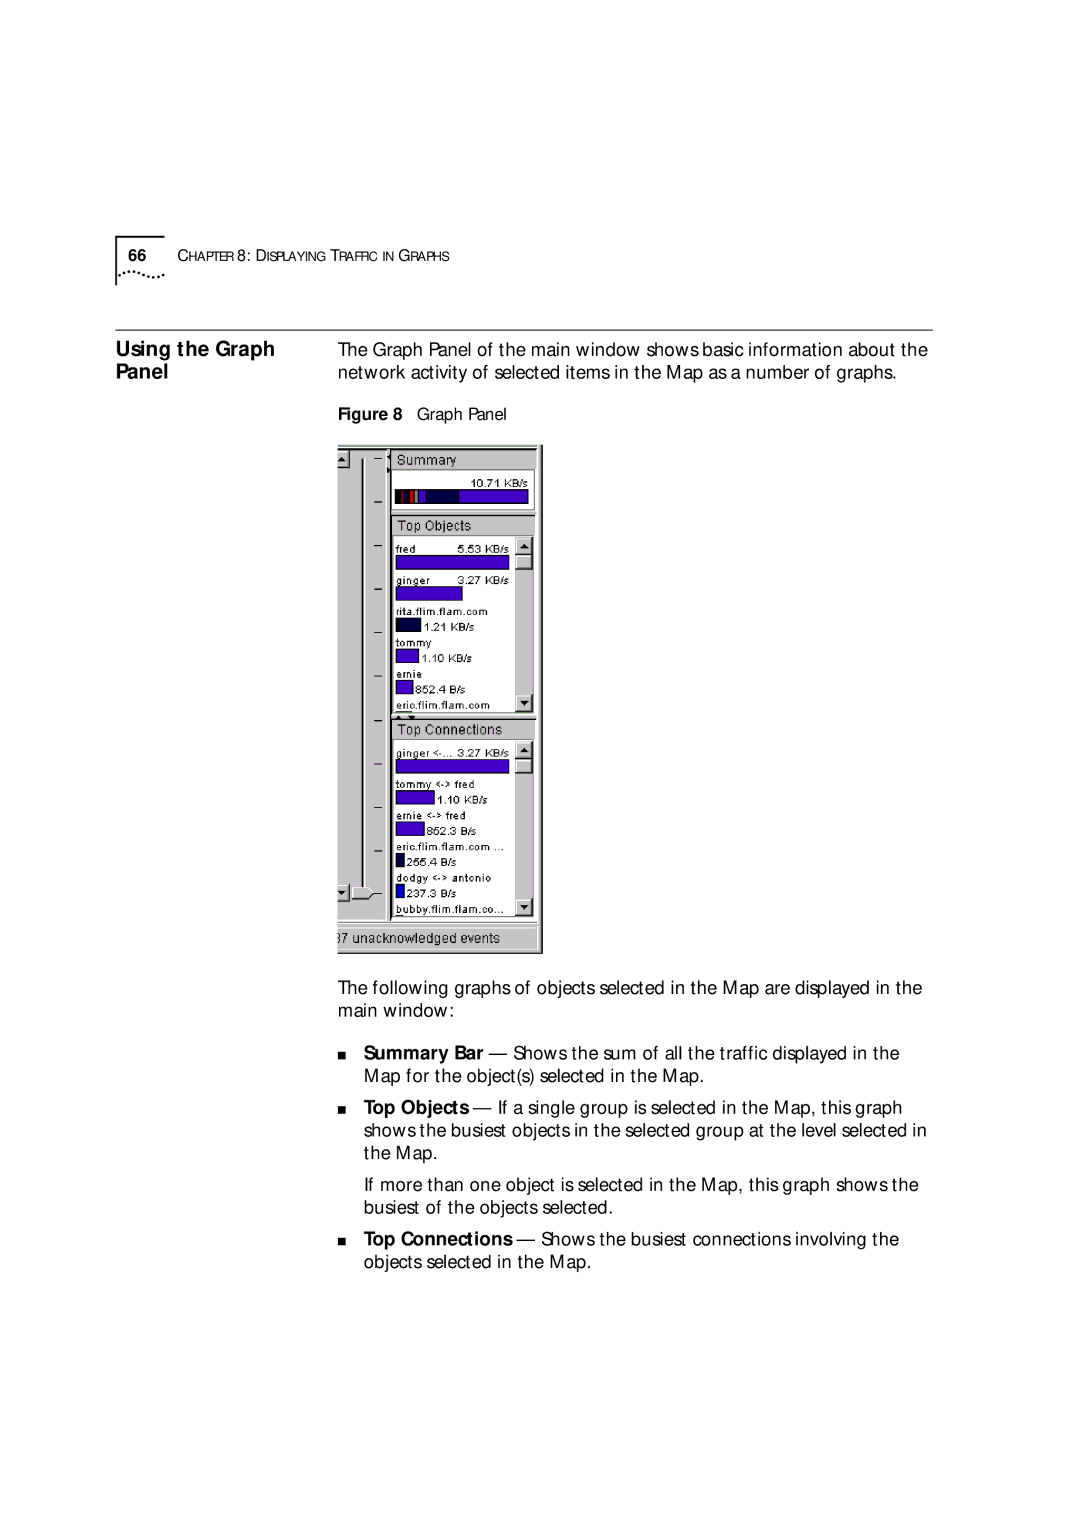
| Figure 8 Graph Panel |
The following graphs of objects selected in the Map are displayed in the main window:
■Summary Bar — Shows the sum of all the traffic displayed in the Map for the object(s) selected in the Map.
■Top Objects — If a single group is selected in the Map, this graph shows the busiest objects in the selected group at the level selected in the Map.
If more than one object is selected in the Map, this graph shows the busiest of the objects selected.
■Top Connections — Shows the busiest connections involving the objects selected in the Map.