N150 and N300 WiFi DSL Modem Routers
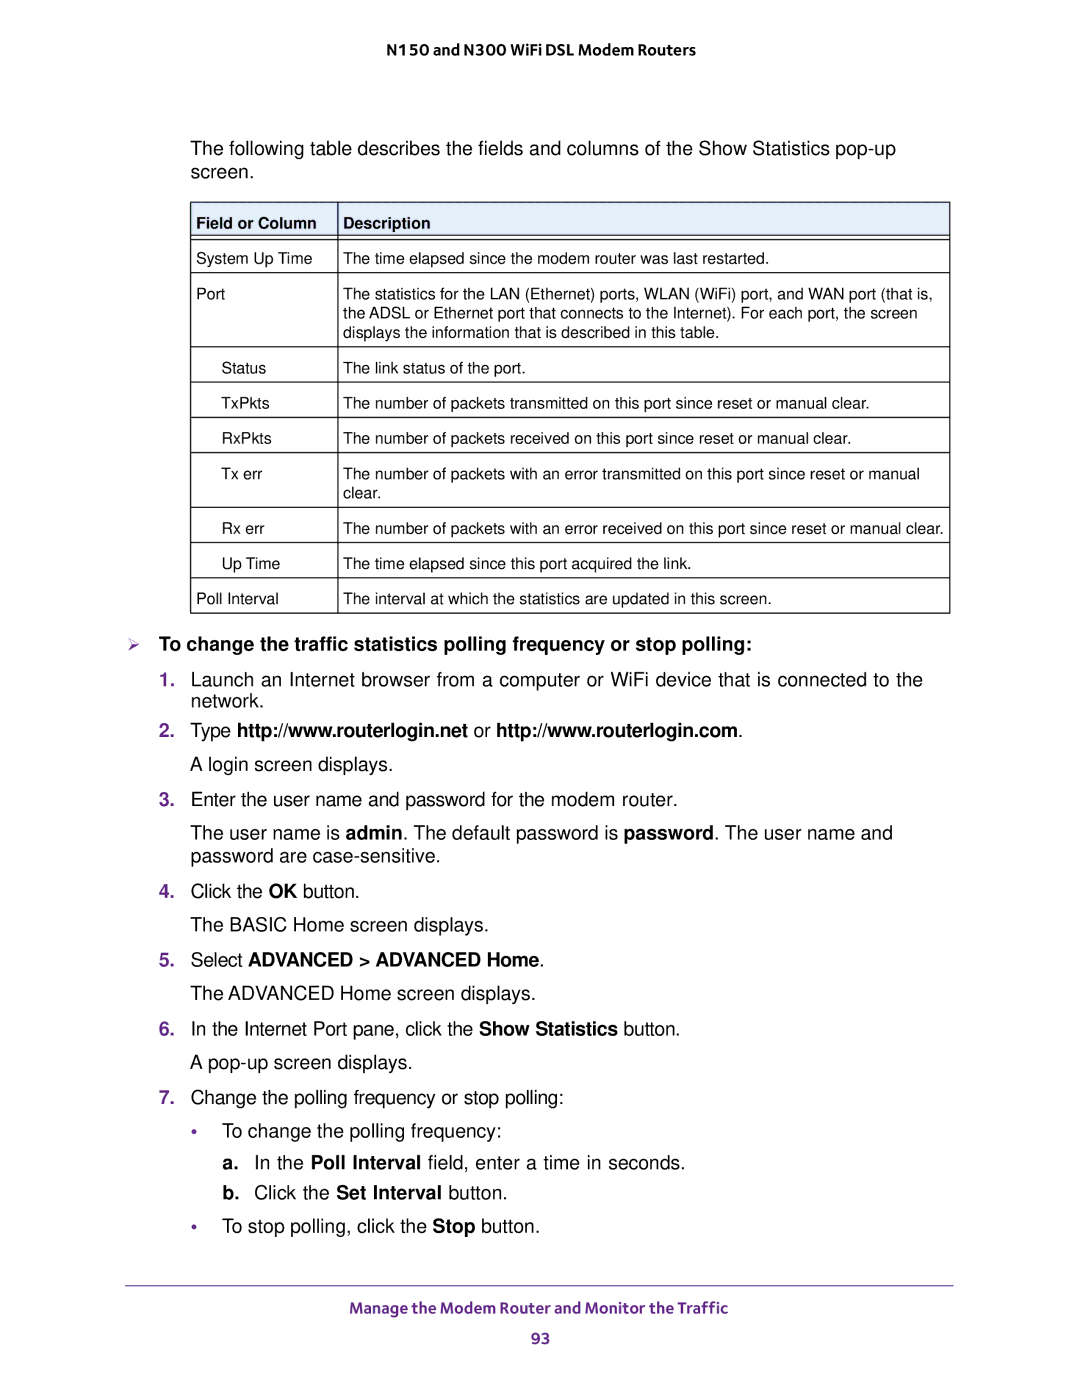
The following table describes the fields and columns of the Show Statistics
Field or Column | Description |
|
|
System Up Time | The time elapsed since the modem router was last restarted. |
|
|
Port | The statistics for the LAN (Ethernet) ports, WLAN (WiFi) port, and WAN port (that is, |
| the ADSL or Ethernet port that connects to the Internet). For each port, the screen |
| displays the information that is described in this table. |
|
|
Status | The link status of the port. |
|
|
TxPkts | The number of packets transmitted on this port since reset or manual clear. |
|
|
RxPkts | The number of packets received on this port since reset or manual clear. |
|
|
Tx err | The number of packets with an error transmitted on this port since reset or manual |
| clear. |
|
|
Rx err | The number of packets with an error received on this port since reset or manual clear. |
|
|
Up Time | The time elapsed since this port acquired the link. |
|
|
Poll Interval | The interval at which the statistics are updated in this screen. |
|
|
To change the traffic statistics polling frequency or stop polling:
1.Launch an Internet browser from a computer or WiFi device that is connected to the network.
2.Type http://www.routerlogin.net or http://www.routerlogin.com. A login screen displays.
3.Enter the user name and password for the modem router.
The user name is admin. The default password is password. The user name and password are
4.Click the OK button.
The BASIC Home screen displays.
5.Select ADVANCED > ADVANCED Home. The ADVANCED Home screen displays.
6.In the Internet Port pane, click the Show Statistics button. A
7.Change the polling frequency or stop polling:
•To change the polling frequency:
a.In the Poll Interval field, enter a time in seconds.
b.Click the Set Interval button.
•To stop polling, click the Stop button.
Manage the Modem Router and Monitor the Traffic
93
