6000 specifications
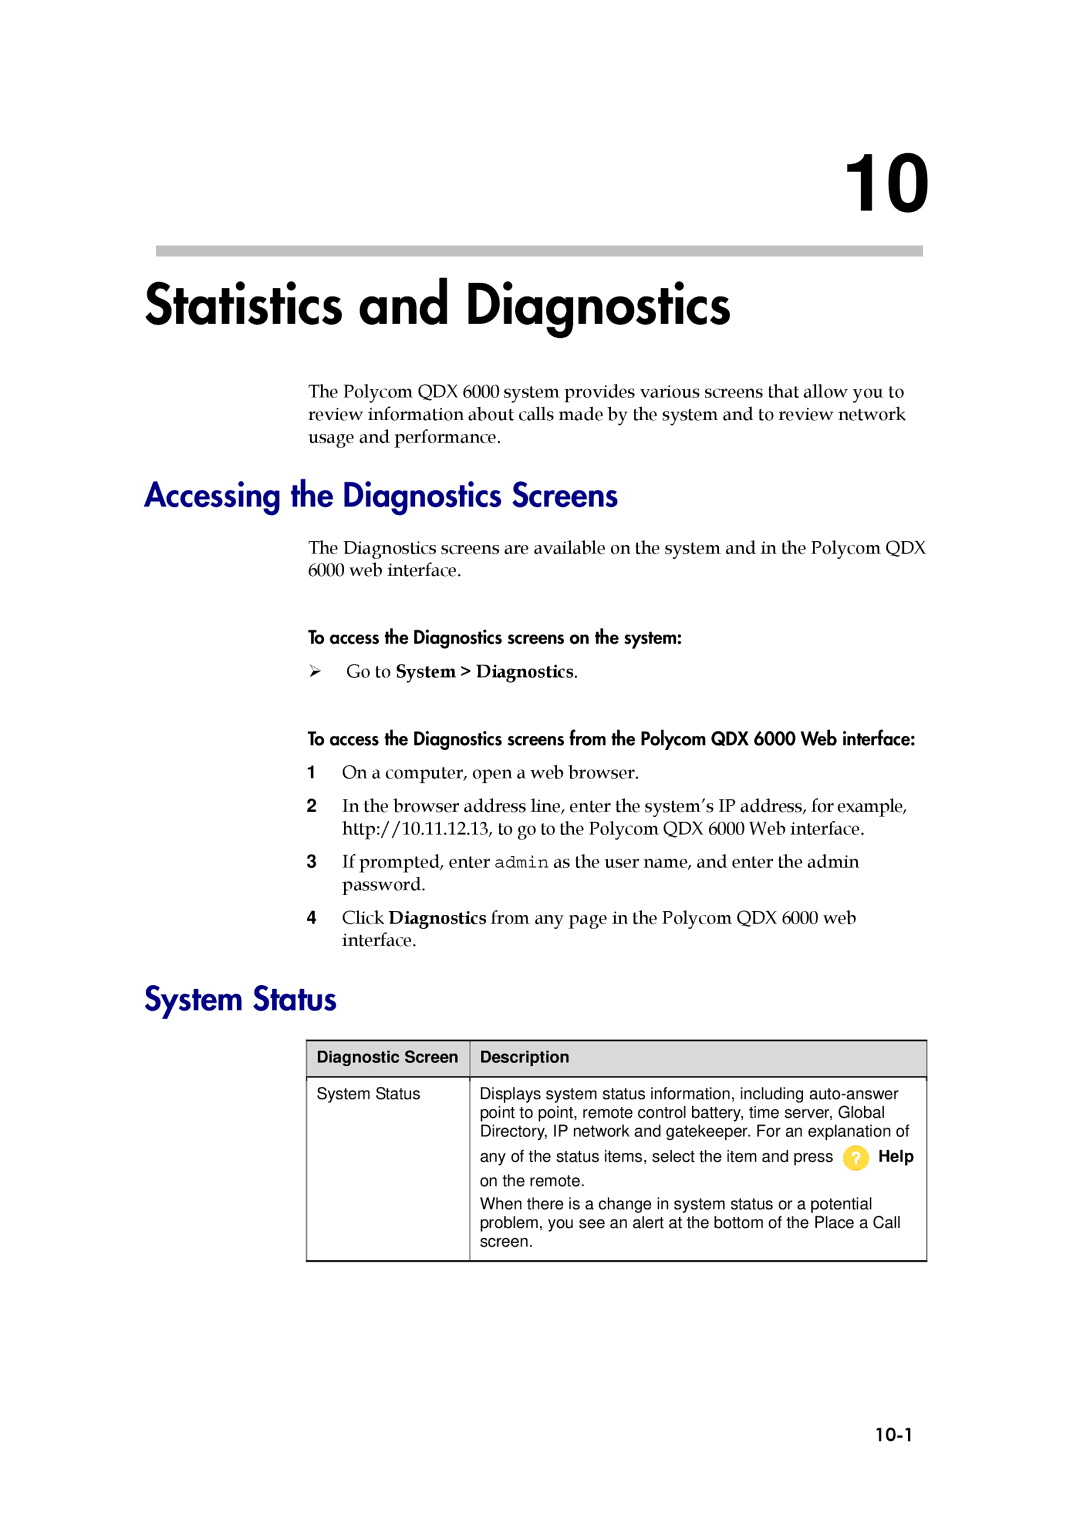
The Polycom 6000, officially known as the Polycom RealPresence Group 6000, is an advanced video conferencing solution designed to facilitate seamless communication in various business environments. This high-definition system is specifically engineered for medium to large conference rooms, providing a superior collaboration experience for teams and organizations.One of the standout features of the Polycom 6000 is its outstanding video quality. The system supports 1080p resolution at 60 frames per second, ensuring that every detail is crystal clear. This is crucial for effective communication, as it allows participants to see facial expressions and body language, which are essential for meaningful interaction. Coupled with Polycom's advanced video technology, the system can adapt to varying network conditions, ensuring that the video remains smooth and stable even in less than ideal circumstances.
Another significant characteristic of the Polycom 6000 is its interoperability. It seamlessly integrates with a range of other video conferencing solutions, including those from competitor brands. This flexibility allows businesses to connect with partners and clients who may not use the same technology, enhancing collaboration across different platforms. The system also supports standards-based protocols, making it a versatile choice for organizations looking to future-proof their communications.
Audio quality is equally impressive, as the Polycom 6000 features Polycom’s Acoustic Clarity technology. This technology provides full-duplex audio, ensuring that users can listen and speak simultaneously without interruptions or echoes. The system is equipped with directional microphones that capture sound clearly from every corner of the conference room, making it ideal for group discussions.
The Polycom 6000 also boasts advanced content sharing capabilities. Users can easily present documents, slides, and videos during meetings through the system's intuitive interface. With the support for wireless content sharing, participants can connect their devices without any cumbersome cables, making the overall meeting experience more fluid and engaging.
Security is a top priority for any modern communication tool, and the Polycom 6000 delivers robust security features. It includes encryption protocols to ensure that conversations remain confidential and secure from potential threats.
In conclusion, the Polycom 6000 is a powerful video conferencing solution characterized by exceptional video and audio quality, interoperability, advanced content sharing capabilities, and strong security protocols. It is a worthy investment for any organization seeking to enhance its communication and collaboration efforts.

