MSAP2000
Copyright
Disclaimer
Trademark
FCC Statement
Interference Statements and Warnings
FCC Warning CE Mark Warning
Registration
Safety Warnings
ZyXEL Limited Warranty
Customer Support
Table of Contents
12.1
CH a P T E R
114
137
190
27.2.2
218
237
Page
Related Documentation
About This Users Guide
Syntax Conventions
ZyXEL Web Site
User Guide Feedback
Graphics Icons Key
Firmware Naming Conventions
MSAP2000 Aams
Getting to Know Your
RJ-45 connectors
Introduction
System Description
Adsl Compliance
Console Port thru UI menu from MSAP2000 MPM IP Protocols
MAC Media Access Control Count Filter
Ieee 802.1x Port-based Authentication
Ieee 802.1p Priority
Multiple PVC and ATM QoS
MTU Application
Applications
MTU Application
Curbside Application
Front Panel
Hardware Specification
Front Access Ports
LED Status Description
Front Panel LEDs
Green :Normal Working
LED status and description
Console Port via MSAP2000 MPM
Default Ethernet Settings
MSAP2000 Aams Specification Hardware
Hardware specification
Dimension
Interface Standard
Web Configurator Overview
Web Configurator Introduction
Accessing the Web Configurator
Password
Home Screen
This is the web configurators Home screen
Navigation Panel Sub-links Overview
Web Configurator Screens
MSAP2000 Aams User’s Guide Web Configurator Screens
Saving Your Configuration
Changing Your Password
Logging Out of the Web Configurator
Initial Configuration
Initial Configuration Overview
Initial Configuration
Under Basic Setting, click xDSL Port Setup
Click VC Setup
Select Ports
Deleting a PVC
Click Config Save and Config Save
This table lists major default settings
Default Settings
Default Settings
VID
VPI VCI
MSAP2000 Aams User’s Guide Default Settings
Defval
UBR PCR
Home and Port Statistics Screens
Home and Port Statistics Screens Overview
Screen as shown next
Ethernet Port Statistics
Following table describes the labels in this screen
Enet
Ethernet Port Statistics
MSAP2000 Aams User’s Guide Ethernet Port Statistics
Adsl Port Statistics
Adsl Port Statistics
VPI/VCI
MSAP2000 Aams User’s Guide Adsl Port Statistics
Basic Setting Screens
Basic Setting Screens Overview
System Information
System Information
MSAP2000 Aams User’s Guide System Information
General Setup
MAX
MIN
General Setup
Igmp Snooping
MSAP2000 Aams User’s Guide General Setup
Switch Setup
Switch Setup Screen
MSAP2000 Aams User’s Guide Switch Setup
Enet Port Setup
IP Setup
Following table describes the fields in this screen
Enet Port Setup
Adsl Standards Overview
Adsl Port Setup
Downstream and Upstream
Profiles
Interleave Delay
Configured Versus Actual Rate
Fast Mode
XDSL Port Setup
XDSL Port Setting screen
MSAP2000 Aams User’s Guide XDSL Port Setup
XDSL Port Setting
Virtual Channels
PMM
SRA
2 LLC
Super Channel
VC Mux
Virtual Channel Profile
VPI
VC Setup Screen
Desired settings. Then you can delete any unwanted PVCs
Want to change other settings, add a new PVC with
MSAP2000 Aams User’s Guide VC Setup
Pvid
MSAP2000 Aams User’s Guide VC Setup
Port Profile Screen
Port Profile
MSAP2000 Aams User’s Guide Port Profile
Traffic Shaping
ATM QoS
ATM Traffic Classes
Constant Bit Rate CBR
Unspecified Bit Rate UBR
Traffic Parameters
Peak Cell Rate PCR
Sustained Cell Rate SCR
VC Profile Screen
Cell Delay Variation Tolerance Cdvt
Burst Tolerance BT
Theoretical Arrival Time TAT
VC Profile
AAL
SCR
MSAP2000 Aams User’s Guide VC Profile
Alarm Profile Screen
ATU-R
ATU-C
Igmp Filter Profile Screen
MSAP2000 Aams User’s Guide Alarm Profile
Igmp Filter Profile
MSAP2000 Aams User’s Guide Igmp Filter Profile
Line Rate Information
Counters. Line Data
Line Performance
Line Performance
MSAP2000 Aams User’s Guide Line Performance
Line Data
Line Data
Following table describes the fields in this screen
This chapter shows you how to configure 802.1Q tagged VLANs
Introduction to VLANs
Introduction to Ieee 802.1Q Tagged Vlan
Forwarding Tagged and Untagged Frames
Automatic Vlan Registration
Garp
Tpid
Vlan Status
Garp Timers
Gvrp
Ieee 802.1Q Vlan Terminology
Vlan Status
Static Vlan Setting
Static Vlan Setting
Vlan Port Setting
MSAP2000 Aams User’s Guide Static Vlan Setting
Vlan ID
Gvrp
Vlan Port Setting
118
MSAP2000 Aams User’s Guide Vlan Port Setting
Igmp Snooping
Igmp Snooping Screen
This chapter describes the Igmp Snooping screen
ENET2
Static Multicast Filter
Static Multicast
Static Multicast Screen
This chapter describes the Static Multicast screen
MSAP2000 Aams User’s Guide Static Multicast
Packet Filtering
Packet Filter Configuration
MSAP2000 Aams User’s Guide Packet Filter
MAC Filter
MAC Filter Configuration
MAC Filter Introduction
This chapter introduces the MAC filter
MAC
MAC Filter
STP Path Costs
Spanning Tree Protocol
Rstp Port States
STP Root Ports and Designated Ports
MSAP2000 Aams User’s Guide Rstp Port States
STP Status
MSAP2000 Aams User’s Guide Spanning Tree Protocol Status
Forwarding Delay
Configure STP
MSAP2000 Aams in standalone mode with a
Network topology that has loops
105
Introduction to Authentication
Port Authentication
Port Authentication Configuration
Radius
Port Authentication Radius
Ieee 802.1x Configuration
MSAP2000 Aams User’s Guide Port Authentication Radius
802.1x link to display the screen as shown
109
This chapter shows you how to set up port security
Port Security Setup
Port Security
About Port Security
111
This chapter shows you how to set up Dhcp relay
Dhcp Relay Setup
Dhcp Relay
Dhcp Relay Overview
Dhcp Relay
Dhcp Relay
This chapter explains how to set the syslog parameters
Syslog Setup
Syslog feature sends logs to an external syslog server
Syslog
About Access Control
Access Control
Access Control Overview
This chapter describes how to configure access control
Snmp Management Model
About Snmp
Supported MIBs
Snmp Commands
RFC-1215 Snmp Traps
RFC-1215 Snmp Traps
MSAP2000 Aams User’s Guide RFC-1215 Snmp Traps
Configuring Snmp
ZyXEL Private MIB Snmp Traps
ZyXEL Private MIB Snmp Traps
Access Control Logins
Setting Up the Administrator Login Account
Access Control Service Access Control
Service Access Control Configuration
Icmp
Secured Client Configuration
Static Route
Routing Protocol
MSAP2000 Aams User’s Guide Static Routing
Following table describes the labels in the summary table
Maintenance
Maintenance
Firmware Upgrade
This chapter explains how to use the maintenance screens
Backing Up a Configuration File
Restore a Text Configuration File
Reboot System
Load Factory Defaults
Confirm Restart
Command Line FTP
Diagnostic
Diagnostic
This chapter explains the Diagnostic screen
Log Format
Before using Get LDM Data
Following table lists and describes the system log messages
Log Messages
Nominalnominal mV
MSAP2000 Aams User’s Guide Log Messages
Valuevoltage mV
Voltage released
Line Diagnostics Test Parameters
Line Diagnostics Test Parameters
MSAP2000 Aams User’s Guide Line Diagnostics Test Parameters
QLN
SNR
MAC Table
Introduction to MAC Table
This chapter introduces the MAC Table screen
MAC Table
Viewing the MAC Table
Introduction to ARP Table
ARP Table
Viewing the ARP Table
How ARP Works
ARP Table
Command Line Interface
Commands Overview
Saving Your Configuration
Commands Summary
Disable Index
MSAP2000 Aams User’s Guide Commands
Enable
Set Index start ip
Enable Portlist
Msec0disable
Disable Portlist
Monitor Show
Fast
Set Profile
Map Portlist
Glitegdmtt14
Pvc
Alarmprofi le
Show Portlist
Vpi vci Set Portlist
Sra Enable Portlist
Annexl Enable Portlist
Showmap Port number
Showport Port
Switch Igmpsnoop Show
Pmm Enable Portlist
Garptimer Show
Igmpfilter Set Port
Enet1enet2 Disable
Fwdelay Fwdelay sec
Option82 Enable
Name Enable Vid
Enabledisable
Disable Vid
Sec0disabled Count Show
Portlist Disable
Pppoeonly portlist command
Etbiosdhcpeap
Pppoeiparpnetbiosdhc
Peapoligmpnone command
Name Enable Portlist
Password Delete name
Port port
Secret secret
Arp Show
Netmask Gateway ip Metric name Default
Netmask
Gateway Gateway ip
Restore
Config Show Sysswadsl
Vlan Vlanlist
Port Portlist
Sys Commands
Sys Commands Summary
Sys Commands
End ip
MSAP2000 Aams User’s Guide Sys Commands
Telnetftp
0100~1200
Info Show Command
Sys Command Examples
Set Msec0disable
Syntax
Snmp Overview
Password Command
Get Community Command
Snmp Commands
Set Community Command
Trusted Host Set Command
Trap Community Command
Server Show Command
Trap Destination Set Command
Show Snmp Settings Command
Client Show Command
Server Port Command
Client Set Command
Syslog Show Command
Syslog Server Command
Time Show Command
Syslog Enable Command
Time Set Command
Date Show Command
Date Set Command
Time Server Show Command
Time Server Set Command
Log Show Command
Monitor Show Command
Log Clear Command
Monitor Vlimit Command
This command clears the system error log
Monitor Tlimit Command
Monitor Tlimit Command Example
Adsl Commands Summary
Adsl Commands
Adsl Commands
Down max margin Down min rate
Delete Profile
MSAP2000 Aams User’s Guide Adsl Commands
Vpi vci Super vid = 4094 Priority Vcprofile Delete Portlist
Linediag
Setld Port number
Vbrrt
Loopback
Vbrnrt-vbr Pcr cdvt Scr bt Delete
Vpi vci Super vid = 4094 Priority Vcprofile Delete
172
Adsl Show Command
Adsl Command Examples
= You can specify a single Adsl port 1, all Adsl
Include a range of ports 1,5,6~10
Adsl Disable Command
Adsl Enable Command
This command forcibly enables the specified Adsl ports
This command forcibly disables the specified Adsl ports
Adsl Profile Set Command
Adsl Profile Show Command
Margin
Up max margin
Ras adsl profile set gold fast 800 8000 5 0 30 64 5 0 30
Adsl Profile Map Command
Adsl Profile Delete Command
Adsl Name Command
Adsl Tel Command
Descriptive name for the port
Adsl Loopback Command
Line Diagnostics Get Command
Line Diagnostics Set Command
Alarm Profile Show Command
Adsl Alarm Profile Commands
= The name of an alarm profile
QLN SNR
Alarm Profile Set Command
Following example displays the default alarm profile Defval
ATU-C ATU-R
Number of Severely Errored Seconds that are
Alarm Profile Delete Command
Permitted to occur within 15 minutes
Number of UnAvailable Seconds that are
Alarm Profile Showmap Command
Alarm Profile Map Command
= The number of an Adsl port
Portlist Profile
Show Virtual Channel Profile Command
Virtual Channel Profile Commands
Set Virtual Channel Profile Command
= The name of the virtual channel profile up to 31 Ascii
Delay and the expected transfer delay number
= Cell Delay Variation Tolerance is the accepted
= Peak Cell Rate 0 to 300000 or *, the maximum rate
Tolerance of the difference between a cell’s transfer
PVC Show Command
Delete Virtual Channel Profile Command
PVC Channels
= The name of the virtual channel profile up to
VPI and VCI of an individual PVC
PVC Set Command
Ports or all of the Adsl ports if you do not specify any
Portlist Vpi Vci Super vid = 1..4094 priority Vcprofile
Portlist Vpi vci
PVC Delete Command
27.1 Switch Commands Summary
Switch Commands
Switch Commands
Profile Set name
MSAP2000 Aams User’s Guide Switch Commands
192
Mac mac Delete port
Peapoligmpnonecommand
Ospf
Igmp Filter Commands
Igmp Filter Show Command
Igmp Filter Set Command
Igmp Filter Profile Set Command
Igmp Filter Profile Show Command
Igmp Filter Profile Delete Command
= The name of an Igmp filter profile or all
Igmp filter profiles
Dhcp Relay Server Set Command
Dhcp Relay Commands
Use these commands to configure the Dhcp relay feature
MSAP2000 Aams User’s Guide Igmp Filter Show Command Example
Dhcp Relay Disable Command
Dhcp Relay Enable Command
Dhcp Relay Show Command
Option 82 Enable Command
Option 82 Set Command
Option 82 Disable Command
Ieee 802.1Q Tagged Vlan Overview
Filtering Databases
Garp Timer Show Command
Ieee VLAN1Q Tagged Vlan Configuration Commands
Garp Timer Join Command
Static Entries Svlan Table
Garp Timer Leaveall Command
Garp Timer Leave Command
Vlan Port Show Command
Vlan Set Command
Vlan Pvid Command
Forwarding Process Example
Modify a Static Vlan Table Example
= You can specify a single DSL port 1, all DSL ports
Vlan Frame Type Command
Or a list of DSL ports 1,3 . You can also
Include a range of DSL ports 1,5,6~10
Vlan CPU Show Command
Vlan CPU Set Command
Configuring Management Vlan Example
Vlan Delete Command
Vlan Priority Command
= This is the priority value 0 to 7 to use for incoming
Frames with an Ieee 802.1Q Vlan tag
Vlan Enable
Vlan Disable
Vlan Show Command
MAC Filter Show Command
MAC Filter Commands
Ffffffffffff
Fxxxxxxxxxxx
MAC Filter Disable Command
MAC Filter Enable Command
MAC Filter Delete Command
MAC Filter Set Command
Number of an Adsl port
Source MAC address in 00a0c5123456 format
MAC Count Commands
MAC Count Show Command
MAC Count Enable Command
MAC Count Set Command
MAC Count Disable Command
Packet Filter Show Command
Packet Filter Commands
Packet Filter Set Command
Packet Filter Set Command Example
IP Commands Introduction
IP Commands
IP Settings and Default Gateway
New ip address Netmask
IP Commands Summary
IP Commands
Netmask Gateway ip Metric name
MSAP2000 Aams User’s Guide IP Commands
Show Command
General IP Commands
Ping Command
Route Set Command
Route Show Command
Route Delete Command
ARP Flush Command
ARP Show Command
Statistics Commands Summary
Statistics Commands
Statistics Commands
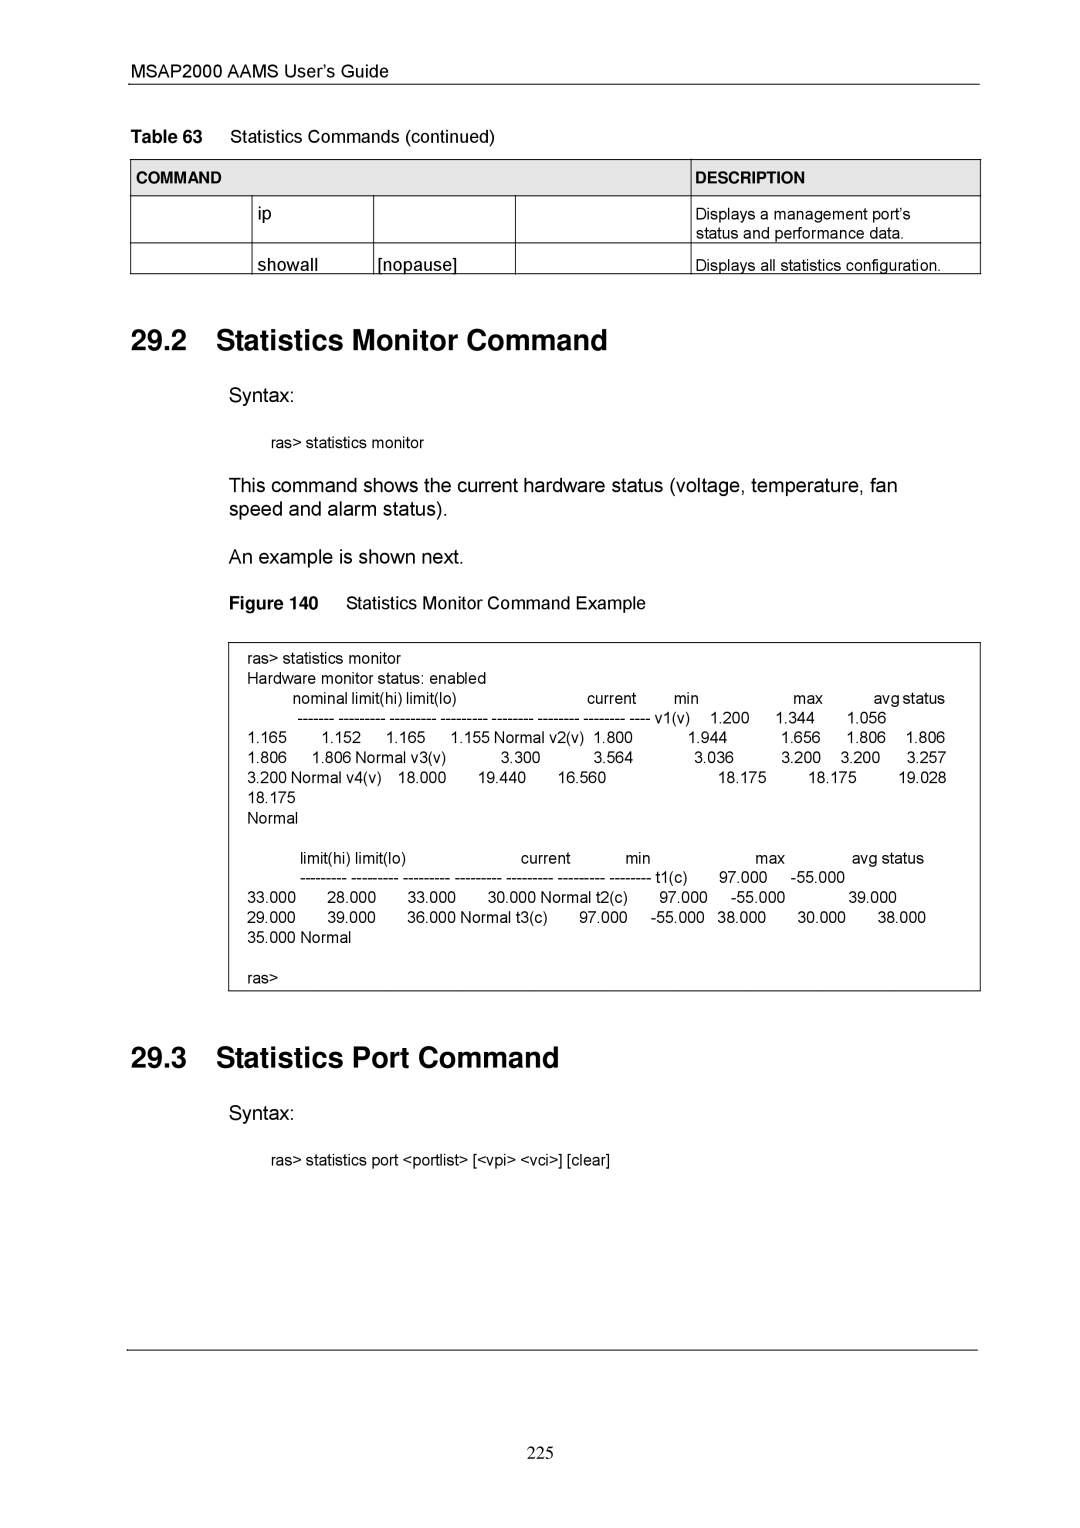
Statistics Monitor
Statistics Port Command
Statistics Monitor Command
MSAP2000 Aams User’s Guide Statistics Commands
Statistics Monitor Command Example
Specified ports or PVC’s counters back to zero
Use clearto have the MSAP2000 Aams set
= This field shows the number of unicast packets
Transmitted on this port
Statistics Adsl Show Command
Statistics Adsl Commands
Statistics Adsl Linedata Command
Use these commands to display Adsl port statistics
Linedata Command Example
Statistics Adsl Lineinfo Command
Lineinfo Command Example
Lineperf Command Example
Adsl Lineperf Command
= Specify for which 15-minute interval 0~96 you
Adsl 15 Minute Performance Command
Want to display performance statistics is
Current 15 minutes
Following table explains these counters
Adsl 1 Day Performance Command
Sesl
Uasl
See on page 259 for details about these counters
Statistics IP Command
Config Commands Summary
Config Commands
Config show Command Example
Config Commands
Config Show Command Example
Firmware and Configuration File Maintenance Overview
Firmware and Configuration File Maintenance
Ftp get config-0 config.txt
Filename Conventions
Editable Configuration File Backup
Editable Configuration File
Enter the management password 1234 by default
Enter the User name just press Enter
Editable Configuration File Upload
Edit Configuration File
Quit FTP
Ftp quit
Password Logged Ftp put xxx.dat config-0
Firmware File Upgrade
SYS LED Troubleshooting
Troubleshooting
ALM LED Troubleshooting
SYS or PWR LED Does Not Turn On
Adsl Voice Troubleshooting
DSL Data Transmission Troubleshooting
DSL Data Transmission
There Is No Voice on an Adsl Connection
MSAP2000 Aams User’s Guide Testing In-house Wiring
Local Server Troubleshooting
Local Server
Password
Configured Settings
Data Rate
Snmp
Resetting the Defaults
Switch Lockout
Telnet Troubleshooting
Telnet
Resetting the Defaults Via Boot Commands
Resetting the Defaults Via CLI Command
MSAP2000 Aams restarts
Type y at the question Do you want to proceedy/n?
Example Xmodem Upload
Recovering the Firmware
248