Agilent 54621D/22D/41D/42D Mixed-Signal Oscilloscopes
Horizontal Controls select sweep speed and delay parameters
Display shows current input signals
Softkeys extend the functionality of command keys
Utilities
This Book
Page
Contents
Trigger Types
Contents
Run/Stop/Single/Infinite Persistence Operation
Using Labels on the Mixed-Signal Oscilloscope
Capturing Data
Saving and Recalling Traces and Setups
Math Functions
Cursor Measurements
Utilities
Contents-6
Getting Started
Getting Started
Getting Started
Setting up the Oscilloscope
To inspect package contents
To inspect package contents
Package contents for 54620/40-Series Oscilloscopes
To inspect options and accessories
To inspect options and accessories
Model Description
To inspect options and accessories Accessories available
Plug Type Cable Part Number
To inspect options and accessories Power Cords
To clean the oscilloscope
Disconnect power from the instrument
To clean the oscilloscope
To adjust the handle
To adjust the handle
To power-on the oscilloscope
Press the power switch
To power-on the oscilloscope
To adjust the waveform intensity
To adjust the waveform intensity
To connect the oscilloscope analog probes
To connect the oscilloscope analog probes
To compensate your analog probe
To compensate your analog probe
Press Autoscale
To use the digital probes mixed-signal oscilloscope only
To use the digital probes mixed-signal oscilloscope only
Connect the clip to a node in the circuit you want to test
Signal Lead Ground Lead Clip
Signals Ground
To connect a printer
To connect an RS-232 cable
To connect a printer
To verify basic oscilloscope operation
Press the Autoscale key on the front panel
To verify basic oscilloscope operation
Getting started using the oscilloscope interface
To verify basic oscilloscope operation
Using Quick Help
Getting Started
Loading an updated language file from floppy disk
Loading an updated language file from floppy disk
Page
Front-Panel Overview
Front-Panel Overview
Using Auto trigger mode versus Normal trigger mode
Using Single versus Run/Stop
Viewing signal detail with acquire mode
Important Oscilloscope Considerations
Important Oscilloscope Considerations
Using Vectors Display menu
Post Acquisition Processing
Delayed Sweep
54620/40-series Oscilloscope Front Panels
54620/40-series Oscilloscope Front Panels
54624A 4-Channel Oscilloscope Front Panel
Entry knob Autoscale key Softkeys
54621D, 54622D D, and 54642D digital channels
Front-Panel Operation
Interpreting the display
Interpreting the display
To use analog channels to view a signal
To use analog channels to view a signal
Example
To use digital channels to view a signal
To use digital channels to view a signal
To display signals automatically using Autoscale
To display signals automatically using Autoscale
How Autoscale Works
Undo Autoscale
To apply the default factory configuration
To apply the default factory configuration
Center the signal on the display using the position knob
To adjust analog channel vertical scaling and position
To adjust analog channel vertical scaling and position
Measurement Hints
To set the vertical expand reference for the analog signal
To set analog channel probe attenuation factor
Expand About Center
To display and rearrange the digital channels
To display and rearrange the digital channels
Press the Main/Delayed, then press the Vernier softkey
To operate the time base controls
To operate the time base controls
To start and stop an acquisition
First set trigger Mode/Coupling Mode softkey to Normal
To make a single acquisition
To start and stop an acquisition
Press the Delayed softkey
To use delayed sweep
To use delayed sweep
Press Main/Delayed
To make cursor measurements
To make cursor measurements
To make automatic measurements
Choose what measurement you want on that source by pressing
To make automatic measurements
To modify the display grid
To print the display
To modify the display grid
Triggering the Oscilloscope
Triggering the Oscilloscope
Trigger Out connector
Selecting Trigger Modes and Conditions
To select the Mode and Coupling menu
To select a trigger mode Normal, Auto, Auto Level
To select a trigger mode Normal, Auto, Auto Level
Auto Level and Auto modes
Normal mode
To select trigger Coupling
To select Noise Reject and HF Reject
To select trigger Coupling
To set holdoff
To set holdoff
To set holdoff Holdoff Operating Hints
External Trigger Probe Settings
External Trigger Input
External Trigger Input
Previous menu
MegaZoom Technology Simplifies Triggering
Trigger Types
To use Edge triggering
Select 1, 2, Ext, or Line as the trigger source
To use Edge triggering
To use Edge triggering
To use Pulse Width triggering
To use Pulse Width triggering
Press the qualifier softkey to select the time qualifier
Qualifier time set softkey
Qualifiers can be set as follows
To use Pattern triggering
To use Pattern triggering
Specifying an Edge in a Pattern
To use can triggering
To use can triggering
Press the Trigger softkey to select the trigger condition
Press the Baud softkey to set the can signal baud rate
To use Duration triggering
To use Duration triggering
To use Duration triggering
When the duration trigger occurs
To use I2C triggering
To use I2C triggering
Ack Data Stop Start Address R/W Condition
Frame Start Addr7 Read Ack Data or
Condition 26th clock edge
To use I2C triggering
To use Sequence triggering
To use Sequence triggering
Sequence Selected
Press the Stage softkey and select Find
Press the Find softkey and select the Find stage condition
Edge Pattern 1 and Edge
Edge Pattern 2 and Edge Nth Edge
Press the Stage softkey and select Trigger on
Edge 1 or Pattern 1 and Edge Timeout
Press the Stage softkey and select Reset on
To use Sequence triggering
To use SPI triggering
To use SPI triggering
Resetting all bits in the serial data string to one value
Assign source channels to the clock, data, and frame signals
To use SPI triggering
To use SPI triggering
To use TV triggering
To use TV triggering
To use TV triggering Provide Correct Matching
Press the Mode softkey to select the TV triggering mode
TV standard Field Alt Field
Alternate Triggering
To trigger on a specific line of video
Line Number Represents Count
Line Numbers per Field for Each TV Standard
To trigger on all TV line sync pulses
To trigger on a specific field of the video signal
To trigger on all fields of the video signal
To trigger on odd or even fields
Holdoff Settings
To use USB triggering
To use USB triggering
To use USB triggering
Trigger Out connector
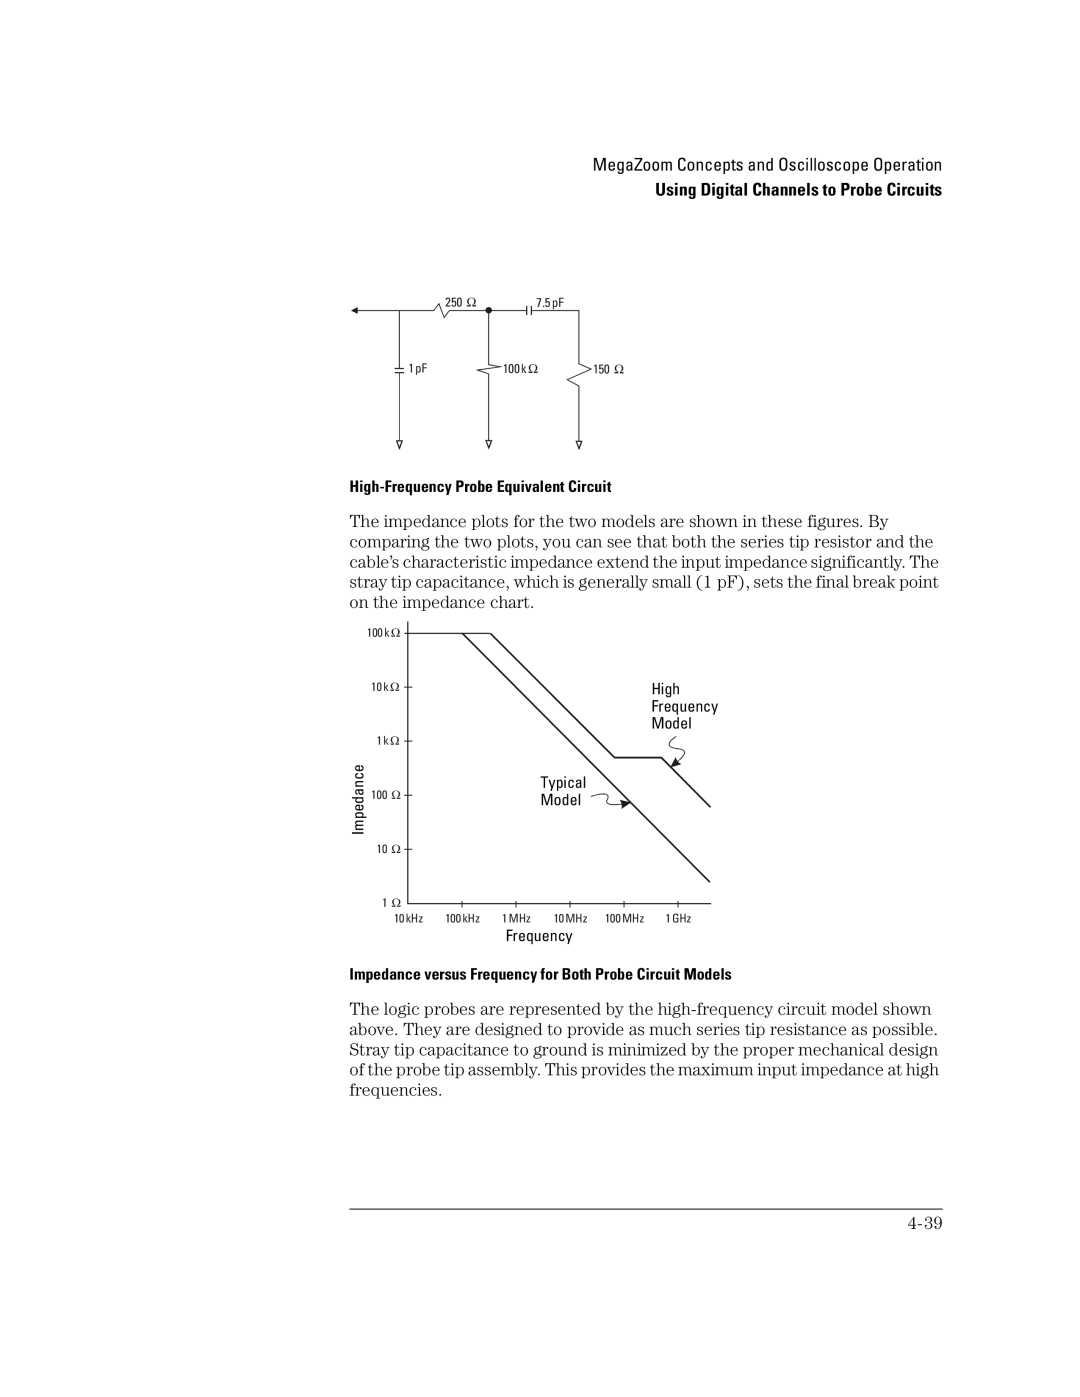
MegaZoom Concepts and Oscilloscope Operation
MegaZoom Concepts and Oscilloscope Operation
MegaZoom Concepts
Deep Memory
Deep Memory
Memory depth values
Oscilloscope Responsiveness
Oscilloscope Responsiveness
MegaZoom Technology
Display Update Rate
Display Update Rate
To setup the Analog channels
To setup the Analog channels
Turning channels off
To setup the Analog channels
Press the Imped impedance softkey
Press the BW Limit softkey to turn on bandwidth limiting
Press the Invert softkey to inverted the selected channel
Press the Probe softkey to display the channel probe menu
Press the Main softkey to select Main horizontal mode
To setup the Horizontal time base
To setup the Horizontal time base
Main mode
Press the Vernier softkey to turn on the time base vernier
To setup the Horizontal time base
Delayed mode
To setup the Horizontal time base
XY mode
Roll mode
Acquisition Modes
Press the Acquire key to display the Acquire menu
Acquisition Modes
Peak Detect
All points displayed after Single or Stop
Smoothing # Avgs=1 or High-resolution mode
Average Mode
Realtime Mode
Press the Display key to view the Display menu
Display modes
Infinite Persistence
Clear display
Vectors On/Off
Pan and Zoom
Pan and Zoom
Zoom
To pan and zoom a waveform
To pan and zoom a waveform
Run/Stop/Single/Infinite Persistence Operation
Acquiring Data
Acquiring Data
Single versus Run/Stop
Memory Depth/Record Length
Memory Depth/Record Length
Run/Stop versus Single
Single
To take a single trace
To run and stop an acquisition
Press the Single key
To run and stop an acquisition
To capture a single event
Connect a signal to the oscilloscope Set up the trigger
To capture a single event
Operating Hints
To use infinite persistence
To use infinite persistence
Clearing stored infinite persistence waveforms
To clear the waveform display
Press the Display key, then press the Clear Display softkey
To clear the waveform display
To display digital channels using Autoscale
Configuring the Mixed-Signal Oscilloscope
Activity indicator
Interpreting the digital waveform display
Interpreting the digital waveform display
List of stacked channels
To turn individual channels on and off
To turn individual channels on and off
To change the display size of the digital channels
To force all channels on or all channels off
Press the Turn on or Turn off softkey
Displayed
To change the logic threshold for digital channels
To change the logic threshold for digital channels
Using Digital Channels to Probe Circuits
Using Digital Channels to Probe Circuits
Input Impedance
High-Frequency Probe Equivalent Circuit
Probe Grounding
Best Probing Practices
Using Labels on the Mixed-Signal Oscilloscope
To turn the label display on or off
To turn the label display on or off
To assign a predefined label to a channel
Press the Label key
To assign a predefined label to a channel
Label Assignment Auto-Increment Features
To define a new label
To define a new label
To define a new label Label List Management
Press the Default Library softkey
To reset the label library to the factory default
To reset the label library to the factory default
Defaulting labels without erasing the default library
Saving and Recalling Traces and Setups
Press the Save/Recall key to display the Save/Recall menu
Making a hardcopy print
To Autosave traces and setups
To Autosave traces and setups
MegaZoom Concepts and Oscilloscope Operation
To save traces and setups to a new file on the floppy disk
To save traces and setups to a new file on the floppy disk
To create a new file name, press the New File softkey
To recall traces and setups
To recall traces and setups
Recalling overwrites current settings
Saving printing screen images to floppy disk
Press the CSV, TIF, or BMP softkey
Saving printing screen images to floppy disk
Recalling the factory default setup
Recalling the factory default setup
Making Measurements
Concepts about the 54620/40-series Oscilloscopes
Making Measurements
Capturing Data
Main and Delayed Sweep
Making Measurements
To use delayed sweep
To reduce the random noise on a signal
To reduce the random noise on a signal
LF Reject
Press the Acquire key, then press the Averaging softkey
Use averaging to reduce noise on the displayed waveform
Smoothing # Avgs=1 or High-resolution mode
Making Measurements
Characterize the glitch with delayed sweep
To use the Roll horizontal mode
Press the Main/Delayed key, then press the Roll softkey
To use the Roll horizontal mode
To use the XY horizontal mode
To use the XY horizontal mode
Signal centered on the display
Calculate the phase difference using the formula below
Signals are 90 out of phase Signals are in phase
Math Operating Hints
Math Functions
Math Scale and Offset
Math Scale and Offset
Math Scale and Offset are Set Automatically
Multiply
Multiply
Subtract
Subtract
Differentiate
Differentiate
Figure below shows an example of differentiate
Integrate
Integrate
Integrate and Signal Offset
FFT Measurement
FFT Measurement
Aliasing
FFT Operation
Scale and offset considerations
FFT Measurement Hints
FFT Measurement FFT Measurement Hints
Cursor Measurements
To make cursor measurements
Select the X and Y softkeys to make a measurement
Cursor Examples
Cursors measure frequency of pulse ringing
Measuring pulse width with cursors
Automatic Measurements
Phase Delay
Average Amplitude Base Maximum Minimum Peak-to-Peak RMS Top
Preshoot Overshoot
Making automatic measurements
Making automatic measurements
Making time measurements automatically
Making time measurements automatically
FFT measurements
Digital channel time measurements
Duty Cycle
Counter
Frequency
Period
Rise Time
Making time measurements automatically Fall Time
+ Width
Width
Isolating an event for frequency measurement
Making time measurements automatically At Min
Making Delay and Phase Measurements
Making Delay and Phase Measurements
Delay
Digital channel measurements
Phase Measurement
Making voltage measurements automatically
Making voltage measurements automatically
Math Measurements and Units
Measurement definitions
Top
Using delayed sweep to isolate a pulse for Top measurement
Making overshoot and preshoot measurements
Making overshoot and preshoot measurements
Preshoot
Making overshoot and preshoot measurements Overshoot
Page
Utilities
Utilities
To configure Quick Help languages
To configure Quick Help languages
Language Info softkey
Loading an updated language file from floppy disk
To update your instrument to the latest application software
To configure a printer
To configure a printer
Press the Format softkey to select the print format
Scale factors
CSV length
Gray scale printing
Form feed
Deleted files cannot be recovered
To use the floppy disk
To use the floppy disk
To set up the I/O port to use a controller
To set up the I/O port to use a controller
Press the XON DTR softkey to set the RS-232 handshake
Press the Baud softkey to set the RS-232 baud rate
RS-232 Connections
Pin Number Signal
To set the clock
To set the clock
To set up the screen saver
To set up the screen saver
Press the Saver softkey to select the screen saver type
To set up the screen saver
To perform service functions
To perform service functions
Press Start User Cal to start the routine
User Cal
User Cal Status
Self test
About Oscilloscope
To set other options
Default Library softkey mixed-signal oscilloscopes only
To set other options
Expand softkey
Performance Characteristics
Performance Characteristics
Agilent 54620-series Performance Characteristics
Acquisition Analog Channels
Acquisition Digital Channels on 54621D and 54622D only
Vertical System Analog Channels
Agilent 54620-series Performance Characteristics
Accuracy = ±2.0%80 mV + 0.4%80 mV = ±1.92 mV
Vertical System Digital Channels 54621D and 54622D only
Sample rate of 200/400 MSa/s
Horizontal
Can
Trigger System
Analog Channel Triggering
Digital D15 D0 Channel Triggering 54621D and 5462 2D
External EXT Triggering
Display System
Measurement Features
Storage
FFT
General Characteristics
Power Requirements
Installation categories
Agilent 54620-series Performance Characteristics
Acquisition Digital Channels on 54641D and 54642D only
Agilent 54640-series Performance Characteristics
Agilent 54640-series Performance Characteristics
Vertical System Digital Channels 54641D and 54642D only
Range Ns/div to 50 s/div Resolution Vernier
Minimum pulse width setting 2 ns
Digital D15 D0 Channel Triggering 54641D and 54642D
Display System
Window Rectangular, Flattop, Hanning Noise Floor
General Characteristics
Page
Numerics
Index
Missing acknowledge condition, I2C trigger
Index
Index-3
Index-4
Declaration of Conformity
EMC
Product Regulations
Declaration of Conformity
Product Regulations
Safety
Agilent Technologies, Inc
Document Warranty