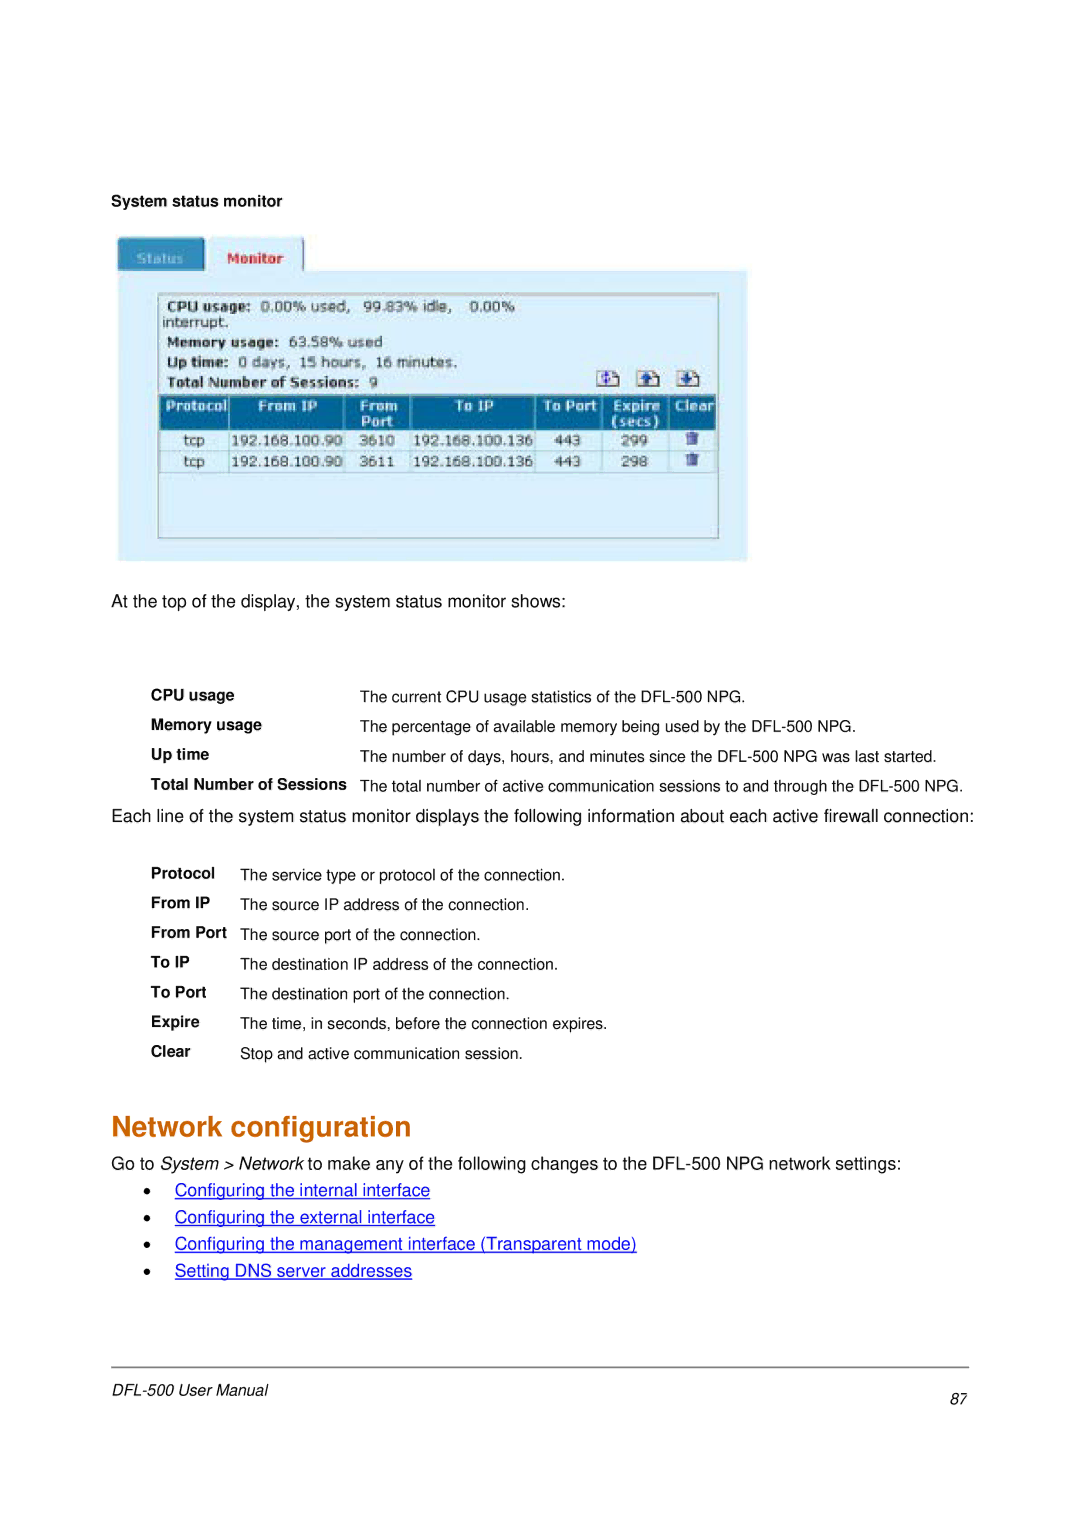
System status monitor
At the top of the display, the system status monitor shows:
CPU usage
Memory usage
Up time
Total Number of Sessions
The current CPU usage statistics of the
The percentage of available memory being used by the
The number of days, hours, and minutes since the
Each line of the system status monitor displays the following information about each active firewall connection:
Protocol
From IP
From Port
To IP
To Port
Expire
Clear
The service type or protocol of the connection. The source IP address of the connection.
The source port of the connection.
The destination IP address of the connection. The destination port of the connection.
The time, in seconds, before the connection expires. Stop and active communication session.
Network configuration
Go to System > Network to make any of the following changes to the
•Configuring the internal interface
•Configuring the external interface
•Configuring the management interface (Transparent mode)
•Setting DNS server addresses
87 | |
|