Administration Guide
North Mathilda Avenue Sunnyvale, California
Series Services Router Administration Guide
Iii
End User License Agreement
Page
Abbreviated Table of Contents
Series Services Router Administration Guide
Table of Contents
Using the telnet Command Using the ssh Command
Modifying USB Modem Initialization Commands
Viii Table of Contents
Management Information Base
Configuring Autoinstallation with a Configuration Editor
Verifying Autoinstallation Status
Event Policy Overview Configuring Event Policies
Part Monitoring a Services Router
Part Managing Services Router Software
Part Diagnosing Performance and Network Problems
Xiii
Part Index
About This Guide
Objectives
Audience
Objectives
How to Use This Guide
Xvi How to Use This Guide
Location of J-series Information
Series Tasks Location of Instruction
Document Conventions
On page xvii defines the notice icons used in this guide
Text and Syntax Conventions
Related Juniper Networks Documentation
Web GUI Conventions
Series Guides and Related Junos Software Publications
Getting Started Guide for Your Router
Related Juniper Networks Documentation
Series Services Router Administration Guide
Chapter in a J-series Guide
Xx Related Juniper Networks Documentation
Documentation Feedback
Requesting Technical Support
Documentation Feedback
Opening a Case with Jtac
Xxii Requesting Technical Support
Configuring a Services Router for Administration
Configuring a Services Router for Administration
Page
Managing User Authentication and Access
User Authentication Terms
System Management Terms
User Authentication Overview
User Authentication
User Authentication Overview
User Accounts
Login Classes
Predefined Login Classes
Permission Bits
Permission Bits for Login Classes
Denying or Allowing Individual Commands
Template Accounts
Managing User Authentication with Quick Configuration
Adding a Radius Server for Authentication
To configure a Radius server with Quick Configuration
Before You Begin
Adding a TACACS+ Server for Authentication
To configure a TACACS+ server with Quick Configuration
Users Quick Configuration for Radius Servers Summary
Radius Server
Configuring System Authentication
To configure system authentication with Quick Configuration
Users Quick Configuration for TACACS+ Servers Summary
TACACS+ Server
To configure users with Quick Configuration
Add a User Quick Configuration Page Summary
Adding New Users
User Information
Managing User Authentication with a Configuration Editor
Setting Up Radius Authentication
Managing User Authentication with a Configuration Editor
Setting Up TACACS+ Authentication
Setting Up Radius Authentication
Setting Up TACACS+ Authentication
172.16.98.24
Set tacplus-server address
Tacacssecret1
Configuring Authentication Order
Configuring Authentication Order
Insert system authentication-order radius
After password
Controlling User Access
Defining Login Classes
Defining Login Classes
EditEdit Configuration
Operator-and-boot with
Operator-and-boot
Request system reboot
Creating User Accounts
Setting Up Template Accounts
ConfigurationView
Creating User Accounts
Set user cmartin class superuser
Creating a Remote Template Account
Creating a Remote Template Account
Creating a Local Template Account
Creating a Local Template Account
Recovering the Root Password
Recovering the Root Password
Ok boot -s
Securing the Console Port
Securing the Console Port
Accessing Remote Devices with the CLI
Using the telnet Command
Securing the Console Port
Using the ssh Command
CLI telnet Command Options
CLI ssh Command Options
Configuring Password Retry Limits for Telnet and SSH Access
Configuring Password Retry Limits for Telnet and SSH Access
Configuring Password Retry Limits for Telnet and SSH Access
ConfigurationView and EditEdit Configuration
Edit system login retry-options
Set backoff-threshold
Page
Setting Up USB Modems for Remote Management
USB Modem Terms
USB Modem Terms
USB Modem Overview
USB Modem Interfaces
USB Modem Terminology
How a Services Router Initializes USB Modems
Series Default Modem Initialization Commands
Setting Up USB Modems for Remote Management
Modem Command Description S7=45
USB Modem Connection and Configuration Overview
USB Modem Connection and Configuration Overview
On the Services Router
At the User End
Connecting the USB Modem to the Services Routers USB Port
Configuring a USB Modem Interface Required
To configure a USB modem interface for the Services Router
Configuring a USB Modem Interface
ConfigurationView EditEdit Configuration
Edit interfaces umd0
S0=0 V1 X4 &C1 E0 Q0 &Q8 %C0
Configuring a Dialer Interface Required
Adding a Dialer Interface to a Services Router
Configuring Dial-In Required
Edit unit
172.20.10.2
172.20.10.1
Configuring Chap on Dialer Interfaces Optional
To configure Chap on the dialer interface
Configuring the Dialer Interface for Dial-In
Configuring Chap on Dialer Interfaces
Ppp-options chap hierarchy level Web Configuration Editor
Edit access
Edit interfaces dl0 unit
Connecting to the Services Router from the User End
Configuring a Dial-Up Modem Connection at the User End
Connecting to the Services Router from the User End
USB-modem-connect-and then click Next
Connecting to the Services Router from the User End
Administering USB Modems
Advanced TCP/IP Settings page appears
Administering USB Modems
Modifying USB Modem Initialization Commands
Modifying USB Modem Initialization Commands
Resetting USB Modems
Verifying the USB Modem Configuration
Modifying USB Modem Initialization Commands
Configure
Verifying a USB Modem Interface
Verifying a USB Modem Interface
Verifying Dialer Interface Configuration
Verifying Dialer Interface Configuration
Setting Up USB Modems for Remote Management
Series Services Router Administration Guide
Configuring Snmp for Network Management
Snmp Architecture
Snmp Architecture
Management Information Base
Snmp Communities
Configuring Snmp for Network Management
Snmp Traps
Spoofing Snmp Traps
Snmp Health Monitor
Configuring Snmp with Quick Configuration
To configure Snmp features with Quick Configuration
Snmp Quick Configuration Summary
Identification
Communities
Traps
Health Monitoring
Checks the following key indicators
Configuring Snmp with a Configuration Editor
Configuring Basic System Identification
Defining System Identification Information Required
Configuring Snmp Agents and Communities Required
Set description
Set name name
Select Engine id
Configuring Snmp Agents and Communities
Managing Snmp Trap Groups Required
Controlling Access to MIBs Optional
Configuring Snmp Trap Groups
Select the Authentication , Chassis ,
Click Categories
Verifying the Snmp Configuration
Verifying Snmp Agent Configuration
Configuring Snmp Views
Verifying Snmp Health Monitor Configuration
Verifying Snmp Health Monitor Configuration
Series Services Router Administration Guide
Configuring Snmp for Network Management
Page
Configuring the Router as a Dhcp Server
Dhcp Terms
Dhcp Terms
Dhcp Overview
Dhcp Terms
Compatibility with Autoinstallation
Conflict Detection and Resolution
Configuring the Router as a Dhcp Server
Dhcp Options
Configuring the Dhcp Server with Quick Configuration
Dhcp Quick Configuration Main
Configuring the Dhcp Server with Quick Configuration
Dhcp Quick Configuration Pool
To configure the Dhcp server with Quick Configuration
Dhcp Quick Configuration Static Binding
Dhcp Server Quick Configuration Pages Summary
Dhcp Pool Information
Lease Time
Server Information
Boot Options
Dhcp Static Binding Information
Configuring the Dhcp Server with a Configuration Editor
Sample Dhcp Server Configuration Settings
Settings Sample Value or Values
Dhcp Subnet Configuration
Dhcp MAC Address Configuration
Configuring the Dhcp Server
Entry
Verifying a Dhcp Server Configuration
Displaying a Dhcp Server Configuration
Ip address
Verifying the Dhcp Binding Database
Verifying the Dhcp Binding Database
Verifying Dhcp Server Operation
Verifying Dhcp Server Operation
User@host ping
Displaying Dhcp Statistics
Displaying Dhcp Statistics
Page
Configuring Autoinstallation
Autoinstallation Terms
Autoinstallation Terms
Autoinstallation
Autoinstallation Overview
Supported Autoinstallation Interfaces and Protocols
Host-specific configuration
Typical Autoinstallation Process on a New Services Router
Configuring Autoinstallation
Before You Begin
Configuring Autoinstallation with a Configuration Editor
Configuring Autoinstallation with a Configuration Editor
Verifying Autoinstallation
Verifying Autoinstallation Status
Configuring Autoinstallation
ConfigurationView and Edit Edit Configuration
Verifying Autoinstallation Status
Page
Automating Network Operations and Troubleshooting
Commit Script Overview
Enabling Commit Scripts
Var/db/scripts/commit directory
Commit the configuration
Disabling Commit Scripts
Enabling Commit Scripts
Operation Script Overview
Enabling Operation Scripts
Executing Operation Scripts
Var/db/scripts/op directory
Enabling Operation Scripts
Running Self-Diagnostics with Event Policies
Running Self-Diagnostics with Event Policies
Disabling Operation Scripts
Configuring Event Policies
Event Policy Overview
Configuring Event Policies
Configuring Destination for Uploading Files for Analysis
Configure or Edit
Configuring Event Policy
Edit then execute-commands
Set output-filename config.txt output-format text
Execute the show interfaces
Set then Set raise-trap
Page
Monitoring a Services Router
Monitoring a Services Router
Page
Monitoring the Router and Routing Operations
Monitoring Terms
Monitoring Overview
Series Monitoring Terms
Monitoring Tools Overview
Monitor Option Function
System
Chassis
Web Monitor Options and Corresponding CLI show Commands
Routing
CoS
Corresponding CLI Commands Interfaces-show mpls interface
Show services nat pool
IPSec
Rsvp Sessions-show rsvp session
Filtering Command Output
Show services rpm probe-results
PPPoE
User@host show configuration match address
Using the Monitoring Tools
Monitoring System Properties
Show system uptime Show system users Show system storage
Summary of Key System Properties Output Fields
Set system hostname command
Name-server command
Set system time-zone command
Users
CPU Usage
Show system processes commands
Monitoring System Process Information
Summary of System Process Information Output Fields
System Storage
Alarm Summary
Monitoring the Chassis
Summary of Key Chassis Output Fields
Field Values
Environment Information
Failed
Absent
Monitoring the Interfaces
FPC Summary
Summary of Key Interfaces Output Fields
Interface Summary
Down
Monitoring Routing Information
MTU
Monitoring Route Information
Show route terse Show route detail
Summary of Key Routing Information Output Fields
Monitoring BGP Routing Information
Show bgp summary Show bgp neighbor
Summary of Key BGP Routing Output Fields
BGP Summary
Down to Up
BGP Neighbors
Monitoring Ospf Routing Information
Summary of Key Ospf Routing Output Fields
Ospf Neighbors
Ospf Interfaces
Monitoring RIP Routing Information
Show rip statistics Show rip neighbors
Summary of Key RIP Routing Output Fields
Ospf Statistics
Monitoring DLSw Routing Information
Summary of Key DLSw Routing Information Output Fields
RIP Neighbors
DLSw Capabilities
DLSw Circuits
DLSw Peers
Monitoring Class-of-Service Performance
Show class-of-service
Show class-of-service interface interface
Monitoring CoS Interfaces
Show class-of-service classifier
Monitoring CoS Classifiers
Summary of Key CoS Interfaces Output Fields
Summary of Key CoS Classifier Output Fields
Show class-of-service code-point-aliases
Monitoring CoS Value Aliases
Show class-of-service drop-profile
Monitoring CoS RED Drop Profiles
Summary of Key CoS Value Alias Output Fields
Summary of Key CoS RED Drop Profile Output Fields
Show class-of-service forwarding-class
Monitoring CoS Forwarding Classes
Show class-of-service rewrite-rules
Monitoring CoS Rewrite Rules
Summary of Key CoS Forwarding Class Output Fields
Summary of Key CoS Rewrite Rules Output Fields
Show class-of-service scheduler-map
Monitoring CoS Scheduler Maps
Summary of Key CoS Scheduler Maps Output Fields
Monitoring Mpls Traffic Engineering Information
Monitoring Mpls Interfaces
Monitoring Mpls LSP Information
Show mpls interface
Show mpls lsp
Monitoring Mpls LSP Statistics
Show mpls lsp statistics
Transit
Monitoring Rsvp Session Information
Show rsvp session
Summary of Key Rsvp Session Information Output Fields
Summary of Key Mpls LSP Statistics Output Fields
Monitoring Mpls Rsvp Interfaces Information
Show rsvp interface
Summary of Key Rsvp Interfaces Information Output Fields
Monitoring Service Sets
Static bandwidth X subscription factor
Summary of Key Service Set Output Fields
Service Set Summary
Monitoring Firewalls
Monitoring Stateful Firewall Statistics
Summary of Key Stateful Firewall Statistics Output Fields
Monitoring Stateful Firewall Filters
Summary of Key Stateful Firewall Filters Output Fields
Bytes
Monitoring Firewall Intrusion Detection Services IDS
IDS Search-Narrowing Characteristics
Narrow Search Box Entry or Selection
Monitoring IPSec Tunnels
On page 140 summarizes key output fields in IPSec displays
Summary of Key Firewall IDS Output Fields
Summary of Key IPSec Output Fields
AH+ESP
IPSec Statistics
IKE Security
Monitoring NAT Pools
Hmac-sha1
Show services nat pool
Monitoring Dhcp
On page 143 summarizes key output fields in NAT displays
Summary of Key NAT Output Fields
Dhcp Conflicts
Dhcp Statistics
Show services rpm probe-results
Monitoring RPM Probes
On page 145 summarizes key output fields in RPM displays
Summary of Key RPM Output Fields
RTT
Round-Trip Time for a Probe
Monitoring PPP
Cumulative Jitter for a Probe
Monitoring PPPoE
Summary of Key PPPoE Output Fields
PPPoE Interfaces
PPPoE Statistics
PPPoE Version
Monitoring the TGM550 Media Gateway VoIP
Summary of Key Media Gateway Information Output Fields
Dynamic Call Admission Control Information
Telephony Gateway Module Information
DSP
Page
Monitoring Events and Managing System Log Files
System Log Message Terms
System Log Message Terms
System Log Messages Overview
System Log Message Destinations
System Log Facilities and Severity Levels
System Logging Facilities
Regular Expressions
System Logging Severity Levels
Common Regular Expression Operators and the Terms They Match
Regular Expression Operator Matching Terms
Configuring System Log Messages with a Configuration Editor
Sending System Log Messages to a File
Sending System Log Messages to a File
Edit system syslog
Sending System Log Messages to a User Terminal
Archiving System Logs
Sending Messages to a User Terminal
Set user frank any critical
Disabling System Logs
Monitoring System Log Messages with the J-Web Event Viewer
Filtering System Log Messages
Filtering System Log Messages
CLI command-show system processes
Installation and Upgrade Guide
Viewing System Log Messages
Viewing System Log Messages
Configuring and Monitoring Alarms
Alarm Terms
Alarm Overview
Alarm Types
Alarm Terms
Interface alarm
Alarm Severity
Alarm Conditions
Interface Alarm Conditions
Configuring and Monitoring Alarms
Interface Alarm Conditions
Pic-hold-reset
Pic-reset
Hw-down
Linkdown
Chassis Alarm Conditions and Corrective Actions
Chassis Alarm Conditions and Corrective Actions
Component Alarm Conditions
Corrective Action Alarm Severity
Configuring Alarms with a Configuration Editor
System Alarm Conditions and Corrective Actions
System Alarm Conditions and Corrective Actions
Alarm Type Alarm Condition Corrective Action
Configuring Interface Alarms
Checking Active Alarms
Show chassis alarms Show system alarms
On page 174 summarizes the output fields on the alarms
Summary of Key Alarm Output Fields
Verifying the Alarms Configuration
Displaying Alarm Configurations
To verify alarms configuration, perform the following task
Edit User@host# show chassis alarms t3
Displaying Alarm Configurations
Managing Services Router Software
Managing Services Router Software
Page
Performing Software Upgrades and Reboots
Upgrade and Downgrade Overview
Upgrade and Downgrade Overview
Upgrade Software Packages
Recovery Software Packages
Downloading Software Upgrades from Juniper Networks
Secondary Storage Devices for Backup
Performing Software Upgrades and Reboots
Installing Software Upgrades with the J-Web Interface
Installing Software Upgrades from a Remote Server
Installing Software Upgrades with the J-Web Interface
Installing Software Upgrades by Uploading Files
Install Remote Summary
Upload Package Summary
Installing Software Upgrades with the CLI
Installing Software Upgrades with the CLI
User@host request system software add unlink no-copy source
Var/tmp/junos-j-series8.5R2.1.tar.gz
Downgrading the Software
Downgrading the Software with the J-Web Interface
Downgrading the Software with the CLI
Downgrading the Software
Configuring Boot Devices
User@host request system reboot
Configuring Boot Devices
User@host request system software rollback
Click OK
Snapshot Summary
Partitions the boot medium
Configuring a Boot Device for Backup with the CLI
CLI request system snapshot Command Options
Option Description Partition
Root-size size
Swap-size size
Recovering Primary Boot Devices
Why Compact Flash Recovery Might Be Necessary
CLI set system dump-device Command Options
Recommended Recovery Hardware and Software
Configuring Internal Compact Flash Recovery
Recommended Recovery Hardware and Software
Recovery Hardware
\ physdiskwrite -u junos-jseries-7.0-20041028.0-export-cf512
Rebooting or Halting a Services Router
Rebooting or Halting a Services Router
Rebooting a Services Router with the CLI
CLI Request System Reboot Command Options
Option Description
Halting a Services Router with the CLI
CLI Request System Halt Command Options
This option is a synonym for the at + minutes option
Page
Cleaning Up Files
Managing Files
Managing Files with the J-Web Interface
Downloading Files
Managing Files with the J-Web Interface
Deleting the Backup Software Image
Cleaning Up Files with the CLI
Deleting the Backup Software Image
Managing Files
Managing Accounting Files
Managing Accounting Files
Encrypting and Decrypting Configuration Files
Encrypting and Decrypting Configuration Files
Gz.jc-for example, juniper.conf.gz.jc
Encrypting Configuration Files
Request system set-encryption-key Commands
CLI Command Description
For example
Decrypting Configuration Files
To begin the encryption process, commit the configuration
To begin the decryption process, commit the configuration
Modifying the Encryption Key
At the second prompt, reenter the new encryption key
Diagnosing Performance and Network Problems
Diagnosing Performance and Network Problems
Page
Using Services Router Diagnostic Tools
Diagnostic Terms
Series Diagnostic Terms
Diagnostic Tools Overview
Web Diagnostic Tools Overview
Web Interface Diagnose and Manage Options
CLI Diagnostic Commands Overview
Manage Options
CLI Diagnostic Command Summary
Diagnosis and Troubleshooting
Command Function Start
Mpls Connection Checking
Options for Checking Mpls Connections
Quit
Locate LSP using
Ping LSP to Layer Ping mpls l3vpn
VPN prefix
Interface name Instance to which this
Mpls Enabled
General Preparation
Ping Mpls Preparation
Loopback Address
Using the J-Web Ping Host Tool
Pinging Hosts from the J-Web Interface
Web Ping Host Field Summary
Pinging Hosts from the J-Web Interface
Ping Host Results
Ping Host Results and Output Summary
Web Ping Host Results and Output Summary
Ping Host Result
Icmpseq=0 Icmpseq=number
Using the J-Web Ping Mpls Tool
Checking Mpls Connections from the J-Web Interface
Checking Mpls Connections from the J-Web Interface
Ping LDP-signaled LSP
Locate LSP using interface name
Web Ping Mpls Field Summary
Ping LSP to Layer 3 VPN prefix
Instance to which this connection belongs
Locate LSP from interface name
Locate LSP from virtual circuit information
Ping end point of LSP
Ping Mpls Results and Output
Web Ping Mpls Results and Output Summary
Field Description
Time
Using the J-Web Traceroute Tool
Tracing Unicast Routes from the J-Web Interface
To use the traceroute tool
Tracing Unicast Routes from the J-Web Interface
Traceroute
Traceroute Field Summary
Traceroute Results and Output Summary
Web Traceroute Results and Output Summary
Using J-Web Packet Capture
Capturing and Viewing Packets with the J-Web Interface
To use J-Web packet capture
Capturing and Viewing Packets with the J-Web Interface
Packet Capture Field Summary
Ge-0/0/0
Advanced Options
Addresses Into hostnames in the packet headers displayed
Packet Capture Results and Output Summary
Web Packet Capture Results and Output Summary
Using CLI Diagnostic Commands
To quit the ping command, press Ctrl-C
CLI ping Command Options
Pinging Hosts from the CLI
Do-not-fragment
Following is sample output from a ping command
Checking Mpls Connections from the CLI
Pinging RSVP-Signaled LSPs and LDP-Signaled LSPs
Following is sample output from a ping mpls command
Following is sample output from a ping mpls l3vpn command
CLI ping mpls l3vpn Command Options
Pinging Layer 3 VPNs
Following is sample output from a ping mpls l2vpn command
CLI ping mpls l2vpn Command Options
Pinging Layer 2 VPNs
CLI ping mpls l2circuit Command Options
Pinging Layer 2 Circuits
Using the traceroute Command
To quit the traceroute command, press Ctrl-C
CLI traceroute Command Options
Tracing Unicast Routes from the CLI
Using the traceroute monitor Command
Following is sample output from a traceroute command
Gateway address
Inet6
To quit the traceroute monitor command, press Q
CLI traceroute monitor Command Options
On page 240 summarizes the output fields of the display
CLI traceroute monitor Command Output Summary
Tracing Multicast Routes from the CLI
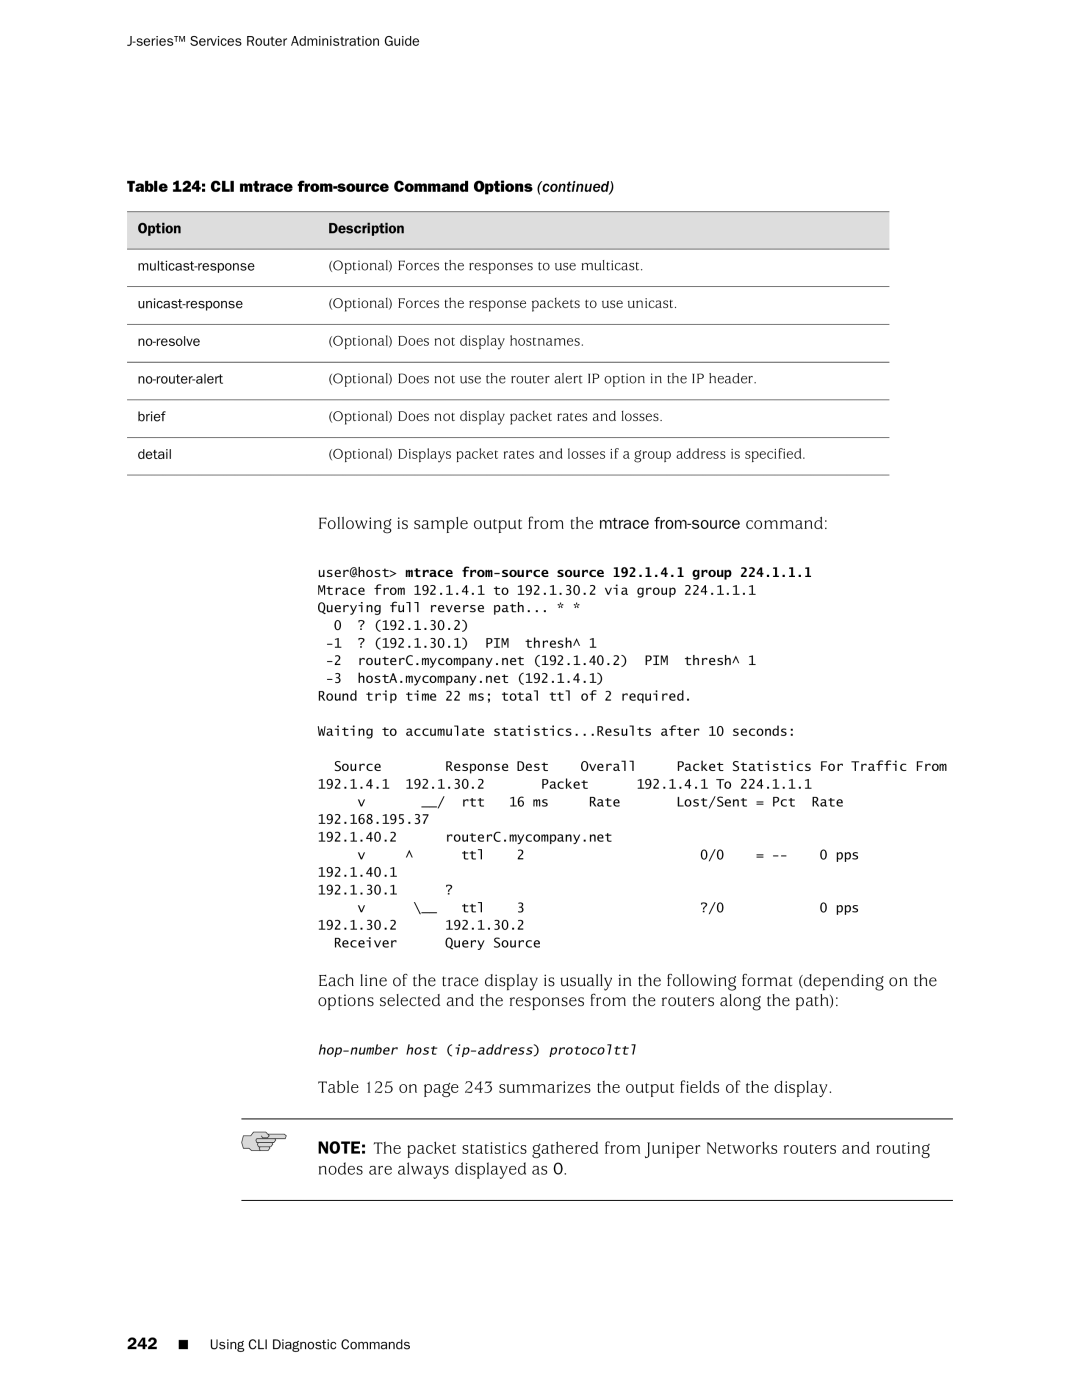
Using the mtrace from-source Command
CLI mtrace from-source Command Options
On page 243 summarizes the output fields of the display
Using the mtrace monitor Command
CLI mtrace from-source Command Output Summary
CLI mtrace monitor Command Output Summary
Displaying Log and Trace Files from the CLI
Using the monitor interface Command
Monitoring Interfaces and Traffic from the CLI
CLI monitor interface Output Control Keys
CLI monitor interface traffic Output Control Keys
Using the monitor traffic Command
User@host monitor interface fe-0/0/0
CLI monitor traffic Command Options
CLI monitor traffic Match Conditions
Option Description Brief
Extensive
Match Condition Description
Directional
CLI monitor traffic Logical Operators
Arithmetic Operator
Binary Operator
Relational Operator
Following is sample output from the monitor traffic command
Page
Configuring Packet Capture
Packet Capture Terms
Packet Capture Terms
Packet Capture Overview
Packet Capture Terms
Configuring Packet Capture
Packet Capture on Router Interfaces
Firewall Filters for Packet Capture
Packet Capture Files
Analysis of Packet Capture Files
Configuring Packet Capture with a Configuration Editor
Enabling Packet Capture Required
Enabling Packet Capture
Navigate to the Forwarding options
Configuring Packet Capture on an Interface Required
Configuring a Firewall Filter for Packet Capture Optional
Configuring Packet Capture on an Interface
259
Configuring a Firewall Filter for Packet Capture
Edit firewall
192.168.1.1/32
Enter set packet-capture disable
Disabling Packet Capture
Deleting Packet Capture Files
261
Return to the CLI operational mode
User@host start shell
Cd /var/tmp
Rm pcap-file.fe.0.0.0
Displaying a Packet Capture Configuration
Verifying Packet Capture
Mv pcap-file.fe.0.0.0 pcap-file.fe.0.0.0.chdsl
Verifying Packet Capture
Verifying Captured Packets
Return to the CLI configuration mode
Ftp lcd /var/tmp Local directory now /cf/var/tmp
Ftp bye Goodbye Edit User@host#
Verifying Captured Packets
Meaning Verify that the output shows the intended packets
Configuring RPM Probes
RPM Terms
RPM Overview
RPM Probes
RPM target
RPM test
Configuring RPM Probes
RPM Tests
Probe and Test Intervals
Jitter Measurement with Hardware Timestamping
RPM Statistics
RPM Statistics
Round-Trip Times
Inbound and Outbound Times Icmp Timestamp Probes Only
Configuring RPM with Quick Configuration
RPM Thresholds and Traps
RPM for BGP Monitoring
RPM Quick Configuration Summary
Configuring RPM with Quick Configuration
Performance Probe Owners
Router Advanced WAN Access Configuration Guide
Maximum Probe Thresholds
Generates Snmp traps when the threshold for standard
Configuring RPM with a Configuration Editor
Configuring Basic RPM Probes
Configuring RPM with a Configuration Editor
Performance Probe Server
Configuring Basic RPM Probes
Edit services rpm
Click Configure
Set probe customerA
Edit services rpm probe customerA
192.178.16.5
Set test icmp-test probe-frequency
Set test icmp-test probe-type icmp-ping-timestamp
Configuring TCP and UDP Probes
Configuring TCP and UDP Probes
Router a Configuration
Router B Configuration
Tuning RPM Probes
Tuning RPM Probes
CustomerA
Set probe-limit
Configuring RPM Probes to Monitor BGP Neighbors
Configuring RPM Probes for BGP Monitoring
Configuring RPM Probes to Monitor BGP Neighbors
Verifying an RPM Configuration
Directing RPM Probes to Select BGP Routers
Directing RPM Probes to Select BGP Routers
Add new entry
Verifying RPM Services
Verifying RPM Services
Verifying RPM Statistics
Verifying RPM Statistics
Verifying RPM Probe Servers
Verifying RPM Probe Servers
Index
Index on
Index
Series Services Router Administration Guide Index
Symbols
112
Chassis
Dd utility, for compact flash recovery 192
Snmp health monitor System logs
Dhcp
Snmp
Junos Internet software
Diagnosing problems from 210 Monitoring from 102
See also Snmp
Permissions
Radius
CLI
See also RPM probes Preparation
Serial number Chassis components
BGP
TACACS+
Routing Engine, too warm
Upgrades
Version Hardware, displaying