Distributed by
Distributed by
Hsb2 Plus Series Color LCD Display
Page
Hsb2 Series Color LCD Display Owner’s Handbook
December
Raymarine Limited
Anchorage Park
Portsmouth Hampshire PO3 5TD England Telephone
System Display Scanner Chartplotter
Preface
TFT LCD Displays
Warranty
EMC Conformance
Contents
Viii
Standard Radar Operations
Standard Chart Operations
Integrated Radar Operations
Further Chart Operations
Going To an Individual Target Point
Installation
Chart Display -RL70/80CRC PLUS, RC530 PLUS, RC631 Plus
Maintenance and Problem Solving
Specification
Using the Auxiliary Junction Box
MAP Chart Card Features
Connecting a Raymarine Heading Sensor
Xiv
How to Use This Handbook
Overview
Howto Use This Handbook
Fishfinder, chart or radar data
Terminology
Unit capable of sourcing specific data such as
High Speed Bus links compatible display units
General
Introduction to hsb2 Systems
Display Unit
Scanner
Features
Plus Display Units
Set Up Options
Display Full-screen mode Half-screen Window Options
Operating Modes
Following are available
Full Screen Operating Modes
Full-screen mode Half-screen Window Options
Multi-display systems
Window Options for Integrated Systems
Providing Heading Data for Radar/Chart Overlay and Marpa
Details on connecting other equipment are given in Chapter
Heading and Position Data
Pathfinder Radar Plus Display
Pathfinder Radar Plus Display Options
3nm
Radar Functions
120@T 6.3kts 5.7kts
14.4m
Chartplotter Display
Chartplotter Display Options
Typical Chartplotter Display
Chartplotter Functions
Operating Controls
Trackpad and Cursor
Moving the Cursor
Context-Sensitive Cursor Control
Cursor is used to Select a position on the screen
Dedicated Keys
Soft Keys
Pop-Up Menus
Typical Pop-up Menu
Database Lists
Waypoint List
Getting Started & Adjusting the Display
Introduction
Conventions Used
Simulator
Switching the Display On and Off
Radar Mode
Power key
Chart Mode
Switch Off
Simulator Mode
Switch Off
Adjusting the Brightness
Changing the Brightness
Selecting the Mode of Operation
Controlling the Display
Using the Display Key
Selecting a Half-Screen Window for Display
Switching Control Between Radar & Chart Screens
Returning to the Full-Screen Display
Radar Half-Screen Window Options
Getting Started
Chartplotter
Switching the Cursor Data Box On and Off
Switching Radar Range Rings or Chart Grid On and Off
Customizing the Screen Presentation Options
Waypoint Display Radar mode
To switch the group of data boxes on or off
Data Boxes
Cursor
Custom Options Chart mode
Screen To display the active waypoint
Using the Zoom Function
Radar Display Control Functions
Press the Zoom soft key to display the following soft keys
Offsetting the Center
Radar Display Zoom Window
Hiding the Ship’s Heading Marker SHM
Radar Display with an Offset Center
Chart Display Control Functions
Moving Around the Chart
Changing the Chart Center
Using Find Ship
10 Changing the Chart Center
Changing the Chart Scale
11 Changing the Chart Scale
12 Chart Boundaries
Center of the screen
Radar/Chart Overlay
Information is available
Range key as many times as required
Radar/Chart Overlay
Typical Chart Scenarios
Goto a Waypoint
Follow a Route
Cursor Echo
Place and Goto a Waypoint
Waypoint
Make and Follow a Route
Make
Review Your Passage Plan
Plan
Displaying the Radar and Synchronizing Radar & Chart
Radarthe Synchronizing Chart
Hsb 2 Plus Series Color LCD Display
Standard Radar Operations
Range Control
Changing the Range
Standard Range Scale
Determining Actual Radar Range
Radar Range Scales
Radar Range
Antenna Height m Target Height m Maximum Range nm
Interpreting and Adjusting the Radar Picture
Controls to Adjust the Radar Picture
Control Option Function Default Setting
Identifying False Echo Returns
Side Lobes
Indirect Echoes
Multiple Echoes
Blind Sectors or Shadow Effect
This is not very common
Adjusting Gain, Sea Clutter, Rain Clutter and Tune
Pulse width used
Gain Control and Sea Control
Change the range scale
Small or weak targets
Speckle and therefore improve target definition
Tuning the Receiver
Rain Clutter Control, using Rain and FTC
Merge and appear as one echo
Bad weather
Changing the Targets Display
Status Bar
Interference Rejection
Target Expansion
Target Wakes
Measuring Range and Bearing Using VRM/EBLs
11 EBL and VRM Displays
Measuring Range and Bearing to Target from Vessel
Placing a VRM/EBL
Moving an Existing VRM/EBL
OFF to on
Measuring Range and Bearing Between Targets Float
Deleting an Existing VRM/EBL
Floating a VRM/EBL
VRM/EBL is reset to your vessel’s position
Moving and Unfloating a Floating EBL
Controlling VRM/EBL Data Boxes
Press the Float soft key
Key to unfloat VRM/EBL2
From on to OFF
Setting Guard Zones and Alarms
13 Guard Zone Display
Placing a Guard Zone
14 Placing a Guard Zone
Moving, Reshaping or Deleting a Guard Zone
OFF
Controlling Guard Zone Alarms
Press the Alarm soft key to highlight the Alarm slider
Marpa
Introduction to Marpa
Risk Assessment
Target Data
Using Marpa
Target Vector and History
Repeater Displays
Radar Range Scales
Cancel a Target
Acquire a Target
View Target Data
Cle drawn around it. The default soft keys are displayed
Played
Key to toggle the data box on/off
Marpa
Integrated Radar Operations
Function of External Data
Data Example source Integrated functions available
Changing the Heading Mode
True and Relative Motion
Heading Modes
Heading modes are as follows
Selecting the Heading and Motion Mode
Effect on VRM/EBLs
Using Marks
Mark is placed using the default symbol
Placing a Mark
Man Overboard MOB
Moving or Deleting a Mark
MOB Alarm
Cursor Echo
Standard Chart Operations
Safety
Using Chart Cards
Inserting a Chart Card
Removing a Chart Card
Displaying the Chart Data
Chart Source Data
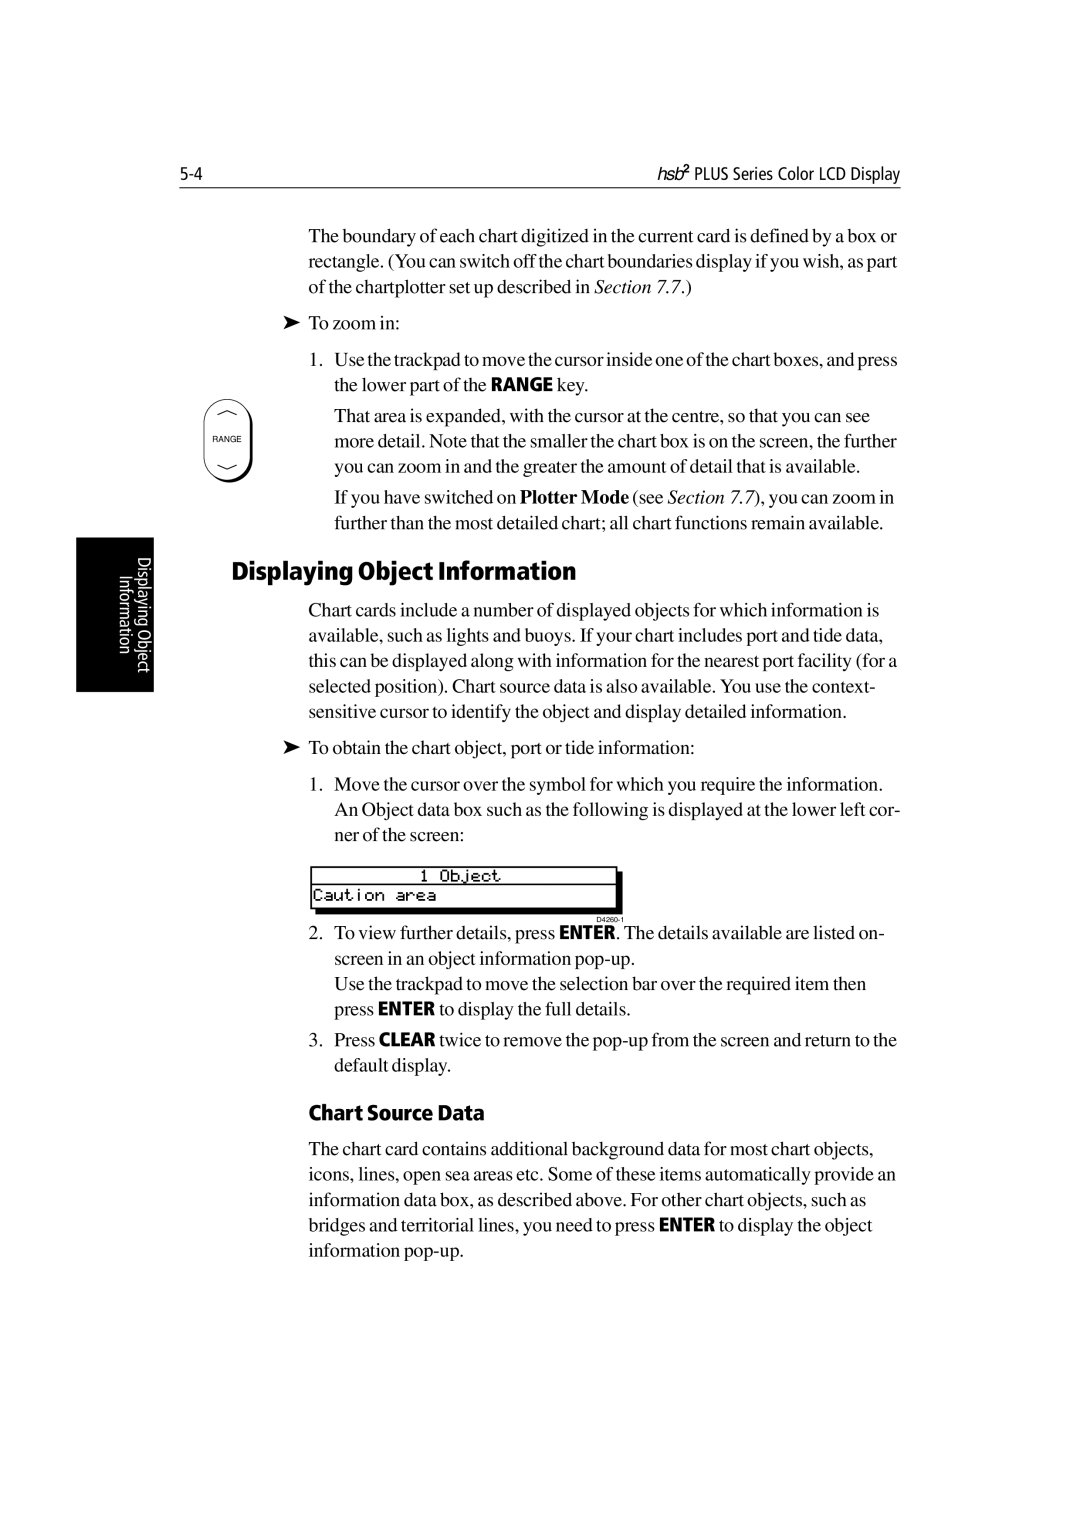
Displaying Object Information
Port Symbols
Port Area
Tide Data
Tide Data
Nearest
Nearest Port Typical Data
Working with Waypoints
Introduction
To access the place waypoint soft keys, press Marks
Placing a Waypoint
Waypoint List
WPT Position Loran TDs
Selecting a Waypoint
Waypoint Data Display
Following soft keys are displayed
Waypoint List and associated soft keys are displayed
Editing the Waypoint Details
Waypoints placed at the vessel position
Screen and the Waypoint List is updated
Erasing a Waypoint
Moving a Waypoint
Waypoint soft keys are displayed
Using the ST60 or ST80 Navigator Keypad
To move a waypoint using the cursor
Selecting an Entry in the Waypoint List
Editing Entries in the Waypoint, Route, or Track Lists
Working with Routes
Creating a New Route
Route soft keys are displayed
When you have entered all your waypoints, either
Bered to identify the new positions
Cursor to the last placed waypoint
Changes to a solid line
Make Route Waypoints
Saving the Current Route
Soft keys are displayed as illustrated in Figure
Next available entry on the route list is highlighted
Clearing the Current Route
Retrieve a Route From the Database
Displaying Route Information
Route Leg and Waypoint Information
Using Route Information to Review Your Passage Plan
To display information about any route in the database
Using the Route List to Erase and Name a Route
Route Information Window
Editing a Route
Inserting a Waypoint into a Route
Adding Waypoints at the End of the Route
Removing a Waypoint from the Route
Reversing the Route
Following Routes and Going to Points
Follow a Route
To follow the current route
Press the Follow Route soft key
Alternatively, to follow a route
Are displayed then press Follow Route
Target Point Arrival
Other Follow Route Options
Joining a Route
Restart Cross Track Error XTE
Going To an Individual Target Point
Advancing to a Waypoint
Stop Follow or Stop Goto
Stop GOTO/FOLLOW soft key
Transferring Waypoints and Routes
Displayed SeaTalk Waypoints
Managing Database Lists
User Card Menu and associated soft keys are displayed
If the operation fails, the Save Failed message is displayed
Press the soft key Receive Wpts from ST/NMEA
Point Transfer soft key
Press the soft key Send WPT List on Nmea
Using Tracks
Using Tracks
Setting Up a Track
Setting Up a Track
Clearing the Current Track
To clear the current track
Managing Tracks
Saving and Naming a Track
Pop-up and associated soft keys are displayed
Next available entry on the track list is highlighted
Naming, Erasing and Showing a Track
Further Chart Operations
COG GPS
Measuring Distances Using the VRM/EBL Key
Measuring Distance Using a VRM
Toggle the ruler line and data box off
To clear the ruler data box
On to toggle the ruler data box off
Enter to take cursor control of the box
Alarms and Timers
Alarm Reporting
External Alarms
Setting Alarms and Timers
Alarm on again
Press Enter to save the changes and clear the list
MOB Display
Are removed
GPS Setup
Navigation Status Window
GPS Set Up
This soft key enables re-acquisition of a GPS position fix
Restart GPS
Data Log Mode
To activate Data Log Mode
Time Position CMG DMG
Hsb 2 Plus Series Color LCD Display
Setting Up the System Defaults
Changing the Set Up Parameters
Depend on the selected operating mode
Setting Up the System Defaults
System Set Up Parameters
System Set Up Parameters
Menu Options Factory New Default
Temperature Units
Bearing Mode
Data Boxes
Cursor Reference
Cursor Readout
Menu Timeout Period
Day/Night
Help
Key Beep
Auto Mode
Manual Mode
Variation Source
Bridge Nmea Heading
Nmea Out Set Up
Date and Time Settings
Cursor Echo
Compass Set Up
GPS SOG/COG Filter
Language
Medium or LOW
Radar Set Up Parameters
Parameter Options Factory Default New Default
EBL Display
Range Default Setting nm New Setting nm
Timed Transmission Option
Marks Options
Custom Scale
Bearing Alignment
Antenna Size
Send on HSB
Radar Range Scale Increments
Marpa Set Up Parameters
Target Vector and Predicted Position
Safe Zone
Target History
Advanced Settings
Display Timing
Function Slider Range
STC Preset
Tune Preset
Chart Set Up Parameters
Customize Chart
Plotter Mode
Chart Orientation
Radar/Chart Synch
Object Information
Waypoint Options
Vectors
Position Offset
To set a new offset value
Installation
Typical System Single Display Unit
Planning the Installation
EMC Installation Guidelines
Suppression Ferrites
Connections to Other Equipment
Parts and Accessories
Unpacking and Inspecting the Components
Supplied with Option for
Selecting the Display Unit Location
Selecting the Display Unit Location
7 LCD Color Display Dimensions
10.4 LCD Color Display Dimensions
Power Cable
Consider the following before installing the system cables
Cable Runs
RC530/631
Inter-Unit Scanner Cable
Hsb2 Cable
Mounting the Display Unit
Mounting Bracket
Console Mounting
Installation
DC Power Connection
Power for External Equipment
System Connections
Grounding the System
Radar Display Connector Panel
Display Unit Connection
Scanner Connection master displays
Radar Scanner Connection
Power and Nmea Input Connection
Any unused wires should be insulated and taped back
Pin No Function Color
Radar System Tests and Installation Alignment
Switch On and Initial Setup
System Check
Radar System Checks and Adjustments
Ensure the display unit is in Radar mode
Transmission Check
Bearing Alignment
Display Timing Adjustment
10 Radar Set Up Menu
11 Radar Display Timing
Integrated Systems
Hsb2 High Speed Bus Multiple Display Systems
DC-DC Converter for External Equipment
Hsb2 Connection
Hsb 2 Series Master Displays
Master Function Display type Transducer
13 hsb2 Connector
Multi-display connections
SeaTalk and Nmea
Function of SeaTalk and Nmea Data
Data Primary Uses Suggested Source
Nmea
SeaTalk
SeaTalk Connection
Nmea
Nmea Input Connection
Using the SeaTalk Auxiliary Junction Box
18 Using the Auxiliary Junction Box
Data Output
Data Conversion
Integrated System Checks
Received Data
Transmitted Data
Transmitted Data
Maintenance and Problem Solving
Maintenance
Cleaning Instructions
EMC Servicing and Safety Guidelines
EMC Servicing Safety Guidelines
Resetting the System
Power On Default Settings
Power-on setting
Problem Solving
Common Problems and Their Solutions
Problem Correction
Technical Support
How to Contact Raymarine US
For Marine Product and Services Information
For Accessories and Parts
For Product Repair and Service
How to Contact Raymarine Europe
Accessories and Parts
Worldwide Support
Appendix ASpecification
Hsb2 Series 7and 10.4 LCD Color Displays
General
Radar Features
Scanner Control
Chartplotter Features
Navigation Information
Interfacing
High Speed Bus
Appendix B Using the Auxiliary Junction Box
Raystar 112, 105, Apelco 182 and 182XT
GPS
Autohelm GPS, Z260 and Z273
Raystar 112, 105, Apelco 182 and 182XT
Raystar 112LP SeaTalk version
Raystar 114 Combined GPS and Differential Beacon Receiver
Spply
Raystar 120 Waas Satellite Differential Receiver
Appendix C C-MAP Chart Card Features
Menu Option Chart Features
Data
Land Features
Following chart features are always displayed
Ports
Features
Hsb 2 Plus Series Color LCD Display
Appendix DSeaTalk and Nmea Data Received and Transmitted
Data Received Source
Data Output SeaTalk Nmea Out
APB, RMB
Appendix E Connecting a Raymarine Heading Sensor
Series Course Computer
Figure E-1 hsb2 System with a G-Series Course Computer
Appendix F Abbreviations
Cross Track Error
Lat Latitude Lbs Pounds
Liquid Crystal Display
Lon Longitude Magnetic Mmeters
Index
BDI
Xvi
Xvii
Xviii
Xix
Hsb2 Plus Series Color LCD Display
Xxi
Xxii
Limited Warranty Certificate
Warranty Limitations
Factory Service Centers
United States of America UK, Europe, Middle East, Far East