7SA511 Numerical Line Protection Relay
Page
Table of Contents
July 27
List of Figures
Table of Contents
This page intentionally blank
Using This Manual
If you want to
Then read
Abbreviations and Acronyms
Glossary of Terms and Abbreviations
Terms
Reclaim time
Pickup
Reverse
Stage
Line Protection Relay 7SA511
Ground fault detection input
This page intentionally blank
Product Description
7SA511 Line Protection Relay Product Description
About the Relay
Relay Setting Types
Relay Features
Address
Relay Setting Descriptions by Address Block
LCD Text
Description
4000
Annunciations Operational Annunciations Last Fault
Fault detection options
Feature
Overview of Protection Functions
Distance Protection
Feature
Power Swing Protection optional
Emergency Overcurrent Protection
Pilot Protection
High-Resistance Ground Fault Protection optional
Automatic Reclose optional
Distance-to-Fault Location
Secured Data Storage
Additional Functions and Features of the Relay
Serial Data Ports
Front Panel Port
Multiple Parameter Sets optional
Acceptance Tests
7SA511 Line Protection Relay Acceptance Tests
IEC Ansi
Test Equipment
Rated Voltage
Inrush peak
Reading the Initial Display
Energizing the Relay
Or Direkteadresse
Verifying the Language Setting
If the display shows Then
Relay Settings for Acceptance Tests
Power Supply Test
Power Consumption Test
Relay Terminal Connections Test Equipment Relay
Alarm Relay Contact Test
Current and Frequency Metering Test
Metering Tests
Model No
Current Input Connections Addr. No
Voltage Metering Test
Voltage Input Connections Addr. No LCD Text
Tolerance
Addr
Binary Input Test
Index No
Input
LED Test
Minus
Addr LCD Text
14. LED Test Current Input Connections
EMERG.O/C on
Signal and Trip Relay Test
Overcurrent Fault Detection Test
Testing the Fault Detection Systems
Prerequisite Settings Addr LCD Text
Setting
Voltage-Controlled Overcurrent Fault Detection Test Optional
Prerequisite Setting Addr. LCD Text
Impedance Fault Detection Test optional
Prerequisite Setting Addr LCD Text
Impedance Zone
VP/V = KRRAIP/IN
Testing the Distance Zones
Fault Type
Setting value X of the distance zone to be checked
Independent Zones Z1, Z2, and Z3
Zone Test Type
Overreach Zones Z1B and Z1L
Testing the Power Swing Blocking Function Optional
Power Swing Exist PROGR. OUT-OF-STEP Trip
Coordination Times
Addr Setting Option Description
Signal Transmission Test
Test
Permissive Underreach Transfer Trip Putt
Putt Mode Action Zone Expected Result
Setting at Address
Pott Mode
Permissive Overreach Transfer Trip Pott
Revers Interlock
Emergency Overcurrent Protection Test
Initial Setup
High-Set Overcurrent
DIST. PROT. NON-EXIST EMERG. O/C Exist
Definite Time Ov rcurrent Protection
Overcu rent T Procedure
Definite Time
High-Set
Input/Output Units
FNo
Inverse Time
Testing the Automatic Reclose AR Function Optional
End of Acceptance Testing
Prerequisite Settings Addr LCD Text Description
This page intenionally blank
Installation
7SA511 Line Protection Relay Installation
7SA511
Receiving and Handling the Relay
Storing the Relay
Preparing the Relay for Installation
Removing the Relay’s Front Cover
Removing/Installing Relay Modules
Removing the basic module
Removing the additional I/O module
Inserting the additional I/O module
Inserting the basic module
Printed Circuit Board Locations
Changing the Binary Input Voltage Range
Installing the Backup Battery
Battery Installation Procedure
View a
View a
Mounting the Relay
General Connection Drawings
Connecting the Relay to Your System
Line-NeutralVL2 Voltage Inputs
Wire Port
#8 Ring lugs #10 Ring lugs
Voltage, Signal & Tripping Terminal Block
B a
14. VT Circuits
Phase CTs with residual connection For ground faults
T. connection with broken-delta for optimum
Pilot Wire Connection Diagrams
StationB
Station
This page intentionally blank
Programming the Relay
7SA511 Relay’s Operator Panel
Operator Panel
Introduction
7SA511
Keypad
Display Panel
On/Off switch
Nameplate
LEDs
General Procedures for Programming the Relay
Reserved Area for LED Labels
Front Serial Data Port
KeyFunction
Placing the Relay in Programming Mode
Using the Navigation Keys
Selecting an Dress
Key
You wa to choose is displayed on the LCD
Changing a S tting
Saving New Settings
Step Action Result By use of the key
Enabling the Relay for Substation Control Optional
Waveform Capture Settings
Preset
Addr LCD Text Description
Options/Range
Fault detection pickup Trip command
Baud
If address 2802 setting is
Relay Scope of Functions
Options
Operating Settings
Section
Operating Parameters
DD.MM.YYYY By Fault Detec
Language OPER. Baud Date Format Fault Indic
MM/DD/YYYY By Trip Command
English
Date
Real-Time Clock
Set Time
Difference Time
Parameter Changeover Optional
Synchronizing the Clock
Configuring Each Parameter in Each Set
Configuring a Parameter Set
Accesses this parameter set
PARAM.C/O
Copying Parameter Sets
Selecting the Active Parameter Set
Address Copy Action
System Settings
Power System Settings
Deactivating Parameter Changeover
Settings for Measured Value Monitoring
Fuse Fail
Distance Protection Settings
Fault Loop Earthed Network Fault Loop NON-EARTHED NET
Addr. Block
Z1B Z1L
General Settings
Independent Zones Z1, Z2, Z3
Controlled Overreach Zones Z1B and Z1L
Zone & Description Preset
Overcurrent Fault Detection Settings
Prerequisite Settings Addr. LCD Text
Zone & Description
Voltage Controlled Overcurrent Fault Detection
Exist U/I
PROG. U/I
Exist Impedance Zone
Polygonal Impedance Fault Detection
PROG. ZA
RA1 RA2 RAE
Determination of the Fault Loop for Grounded Systems
Preset Options/Range
LCD Text Description
Phase Pref
Power Swing Protection 2000 Optional
L3L1 Acyclic
Exist Impedance Zone Exist
Permissive Underreach Transfer
Addr LCD Text Description Preset
Permissive Overreach Transfer
Putt Mode SEND-PRL REC-PROL SEND-DEL
Z1B Acceleration
OFF FD Acceleration
SEND-DEL Echo ECHO-DEL ECHO-IMP ECHO-BLO
Pott Mode Transblo Wait TB SEND-PRL
Z1B Release
Forwards
Stage
MAN. Close
Earthfault
Exist Compensated Isolated
CT ERR CT ERR. F1 CT ERR. F2
Directional D.T. Solidly Earthed
Directional Protection With Nondirectional Backup
Direction NON-DIR
Direct
Block
DIREC. Comparison Solidly Earthed
Nondirectional, Inverse Time Overcurrent Protection
Description Preset
Charac
Normal Inverse
Device Configuration for Automatic Reclose
Option
Internal AR
Automatic Reclose Function Settings
Addr LCD Text Description Preset Options/Range
Terminology
Prerequisite Setting Addr LCD Text Description
Fault Location Settings
Function
Turning the Relay Functions On and Off
See Section
Compar Echo
Procedure for Configuring the Logical Functions
Configuration Settings
BelowFAILU. RELAY424V
Addr Unit Index No
Presettings
LCD Text 2nd line
AR on no AR OFF no
LED
Binary Inputs
Signal Relays
LED Indicators
Trip Relays
This page intentionally blank
Displaying System and Relay Information
This page intentionally blank
Using the Operator Panel to Display Information
Event Log
Ess. ANNUNCIATIONS5000
Event Log Messages
Storage and Display Description
LCD Text 2nd line Description Possible Tag
Binary Inputs
Monitoring Functions
General
Ground Fault Protection
Power Swing Function
Automatic Reclose Function
Circuit Breaker Test Function
Target Log for All Systems 5200, 5300,
Table Status
7SA511 Line Protection Re ay Chapter
Example Sys em Fault Messages
Command. DisTrip46 23C
Target Log Messages
LCD Text 2nd line Description
Distance Protection
High-Resistance Ground Fault Protection in Grounded Systems
Fault Location
Emergency Overcurrent Protection
Automatic Reclose
Began. E/FDetection002104357 C
Circuit Breaker Operation Statistics
Isolated Ground Fault Data Log Messages
Operational Measured Values
Reading the Measured Values
As a percentage of VN Primary specified at address
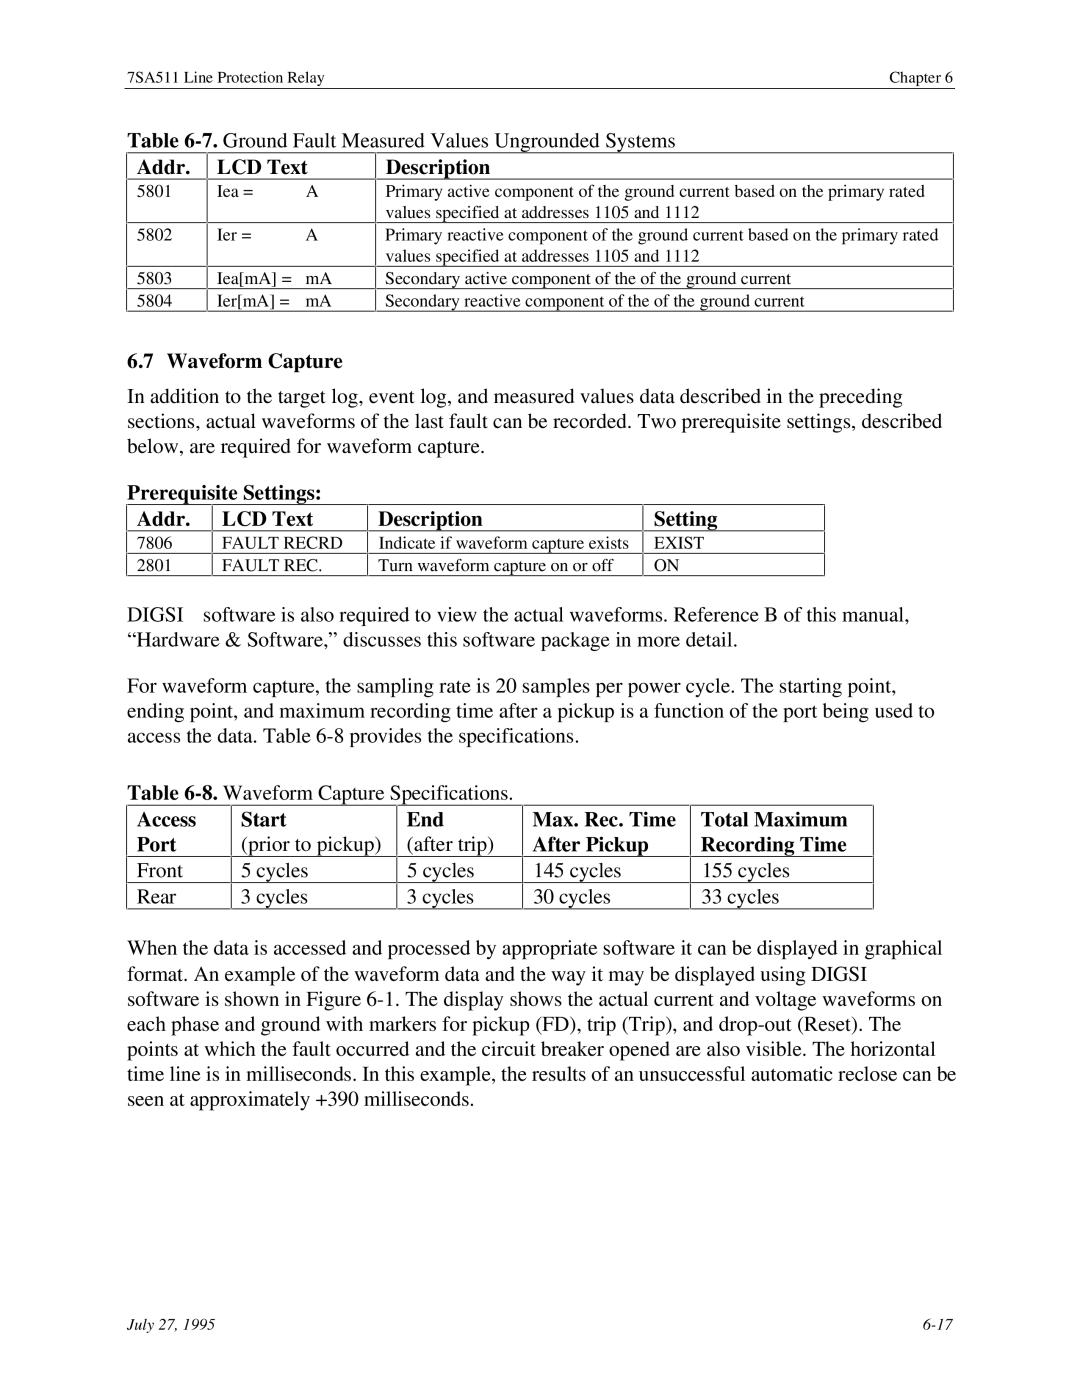
Waveform Capture
Access Start End Port
Max. Rec. Time After Pickup
Total Maximum Recording Time
33..100
Commissioning the Relay
7SA511 Line Protection Relay Commissioning the Relay
Relay Commissioning Tests
Verifying the Installation and Relay Configuration
Symmetry Error
Current, Voltage, and Phase Sequence Checks
Summation Error
Guidelines for Commissioning the Relay
Directional Test Using Load Current
Phase Sequence Check
Measurement Loop
Test Procedure
July 27
Checking the Carrier Transmission System
Overreach Zone Comparison Via Pilot Wires
Overreach Pilot Wire Comp
Teleprotec Pott Mode
Reverse Interlocking
Overreach Revers Interlock
Carrier Transmission With Release Signal
Carrier Transmission With Blocking Signal
Carrier Transmission With Underreach Transfer Signal
Overreach Z1B Blocking
DIREC.COMPARISON OFF
If address 2102 setting is
CB Auxiliary Contact Control
Circuit Breaker Trip Test
4401 4402 4403 4404
Automatic Reclose Test 4300 Optional
Setting Options & Descriptions
LCD Text & Description
AUTO-RECL
TestProcedure
Returning the Relay o Op rating Status
LCD ext
This page intentionally blank
Maintenance
7SA511 Line Protection Relay Maintenance
Electrostatic Discharge Possible equipment damage
Tracing Hardware and Software Faults
Inspecting the Power Supply Fuse
Troub eshooting Tips
Replacing the Backup Battery
Erasing Stored Data
Storing Relays That are Taken Out of Service
Preset Options
Reset Counters ?
What To Do With Defective Relays
This page intentionally blank
Method of Operation
Figure A-1Hardware Structure of the 7SA511 Relay
Figure A-18. Power Swing
7SA511 Line Protection Relay
Overview of Hardware and Protection Functions
Power System Bus
Distance Protection Overview
Voltage Subsystem
Ground Fault Detection and Processing
Overcurrent Fault Detection
PHASE-PHASE
Polygonal Impedance Fault Detection Optional
Phase angle with the R intersection applicable
Voltage Controlled Overcurrent Fault Detection Optional
Resultant Annunciation Loop
Fault Detection Module Measured Ground Fault Current Voltage
− I L
Is replaced by Which gives us
Fault Loop Determination in Grounded Systems
Fault Detection Phases
2PH-E Flts = PHASE-PHASE Leading PH-E Lagging PH-E
Fault Loop Determination in Ungrounded Systems Optional
3PH Faults = Control
3PH Faults = PH-E only