MONITORING THE SWITCH
Displaying RMON Statistics
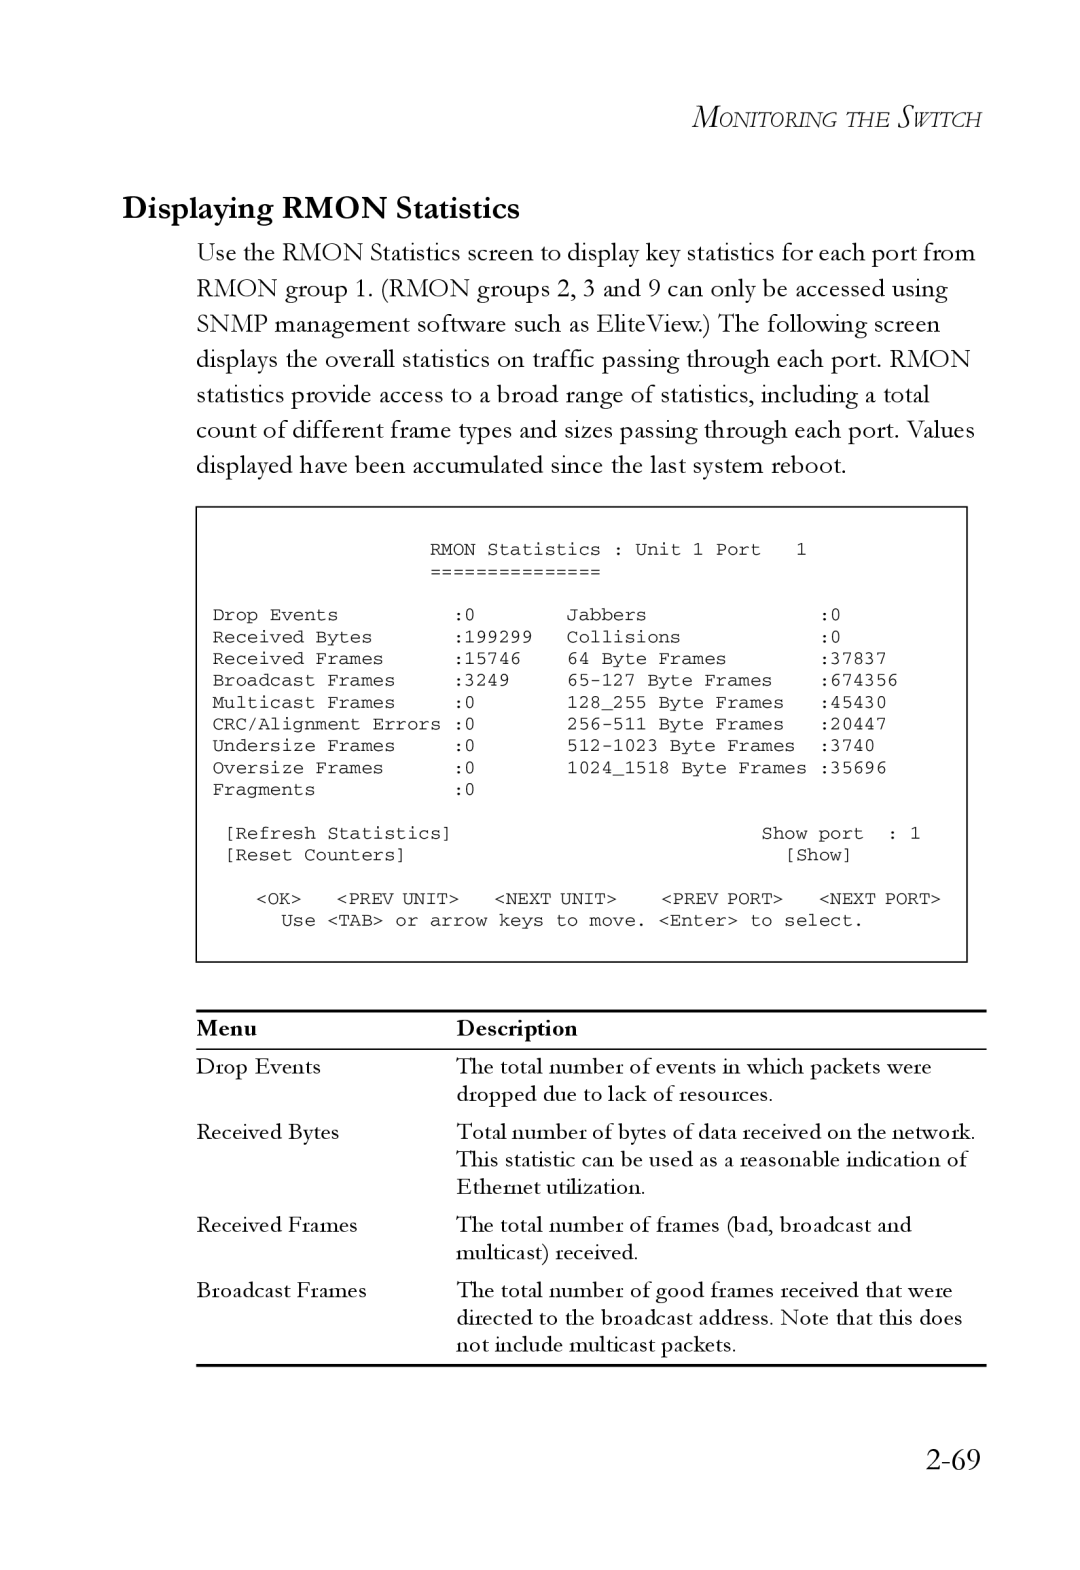
Use the RMON Statistics screen to display key statistics for each port from RMON group 1. (RMON groups 2, 3 and 9 can only be accessed using SNMP management software such as EliteView.) The following screen displays the overall statistics on traffic passing through each port. RMON statistics provide access to a broad range of statistics, including a total count of different frame types and sizes passing through each port. Values displayed have been accumulated since the last system reboot.
| RMON Statistics : Unit 1 Port 1 |
| ||||
| =============== |
|
| |||
Drop Events | :0 |
| Jabbers |
| :0 | |
Received Bytes | :199299 | Collisions | :0 | |||
Received Frames | :15746 | 64 Byte Frames | :37837 | |||
Broadcast | Frames | :3249 | :674356 | |||
Multicast | Frames | :0 |
| 128_255 Byte Frames | :45430 | |
CRC/Alignment Errors | :0 |
| :20447 | |||
Undersize | Frames | :0 |
| :3740 | ||
Oversize Frames | :0 |
| 1024_1518 Byte Frames | :35696 | ||
Fragments |
| :0 |
|
|
|
|
[Refresh | Statistics] |
|
|
| Show | port : 1 |
[Reset Counters] |
|
|
| [Show] | ||
<OK> | <PREV UNIT> | <NEXT UNIT> | <PREV PORT> | <NEXT PORT> | ||
Use | <TAB> or arrow keys to move. <Enter> to select. | |||||
|
|
|
|
|
|
|
Menu | Description |
Drop Events | The total number of events in which packets were |
| dropped due to lack of resources. |
Received Bytes | Total number of bytes of data received on the network. |
| This statistic can be used as a reasonable indication of |
| Ethernet utilization. |
Received Frames | The total number of frames (bad, broadcast and |
| multicast) received. |
Broadcast Frames | The total number of good frames received that were |
| directed to the broadcast address. Note that this does |
| not include multicast packets. |