3.The Sensitivity Control Bar appears. Press ↓ to decrease sensitivity; press ↑ to increase sensitivity. When it's set at the desired level, press EXIT. (When you reach the maximum or minimum limit, a tone sounds.)
The Split Frequency Sonar Chart page allows you to adjust
sensitivity separately for each window.
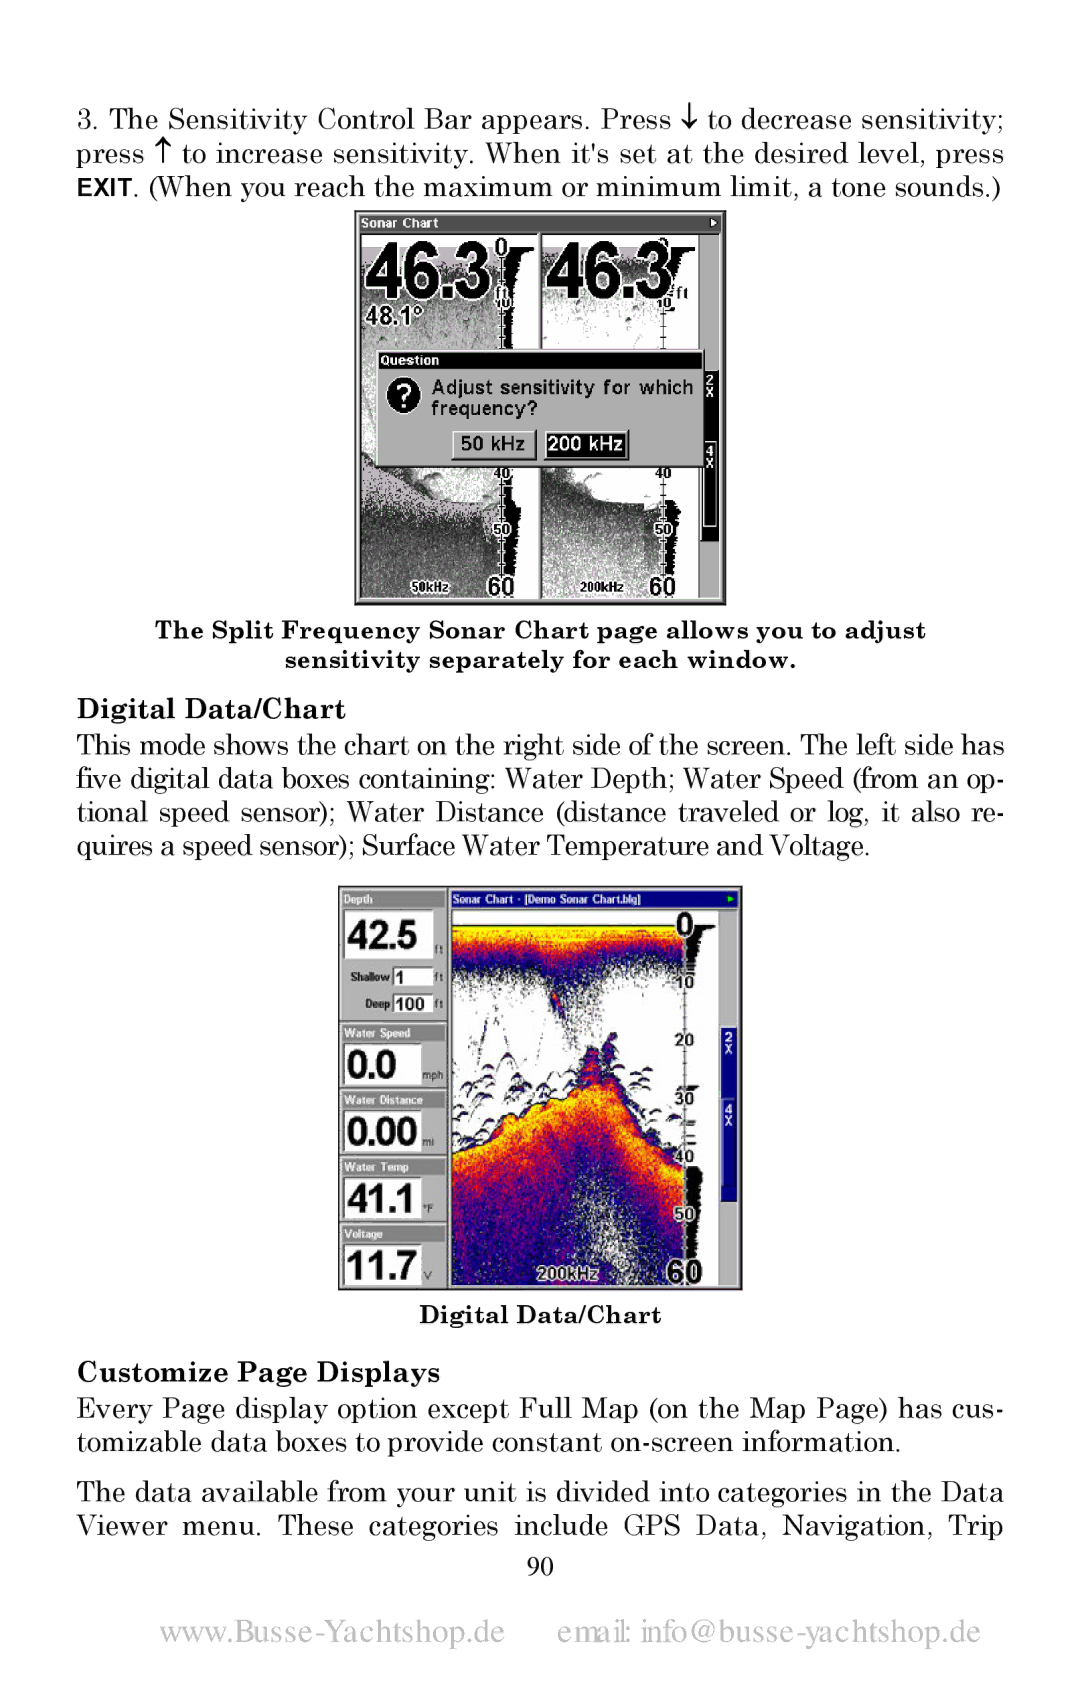
Digital Data/Chart
This mode shows the chart on the right side of the screen. The left side has five digital data boxes containing: Water Depth; Water Speed (from an op- tional speed sensor); Water Distance (distance traveled or log, it also re- quires a speed sensor); Surface Water Temperature and Voltage.
Digital Data/Chart
Customize Page Displays
Every Page display option except Full Map (on the Map Page) has cus- tomizable data boxes to provide constant
The data available from your unit is divided into categories in the Data Viewer menu. These categories include GPS Data, Navigation, Trip
90
