7265
National Character SET
Programmer’s Manual Copyright 2004 TallyGenicom
Default Character Set for Ansi Emulation, 00 to 7F
Introduction
Ansi
Control Code Summary
PLD
Ompar ison, 7 Bi t/ 8 Bi
Bit Control Codes
ESC J
DC1
Escape Sequence Summary
ESC p` Horizontal Position Absolute
ETX ETX/ACK Communication Protocol
Pr inter Handshaking
DC1 Printer Ready
DC3 Printer not Ready
Printer Control
DEL Delete
Select Emulation
Genicom Ansi
Reset to Initial State
ENABLE/DISABLE OVERSIZED/EXPANDED/BAR Code Modes
Graphic Size Modification
Reset Mode Genicom
SET Mode Genicom
Paper Shear
Straps and Options
Select Graphics Rendition
Graphics Rendition Fonts and Modes
USA
Select National Character SET
3National Character Substitutions 0
Line/Character Spacing
LINE/CHARACTER Spacing
CPI
Forms Setup
Forms Setup
Superscript/Subscript
ESC K Subscript Printing PLD
ESC L Superscript Printing PLU
Vertical Movement
ESC D Index IND
Line Feed
Vertical TAB
Form Feed
Vertical and Horizontal Position Absolute
Vertical Position Relative
Vertical Position Backwards
Vertical Position Absolute
Assign Margin Defaults
Margins
SET Left and Right Margin
Horizontal Position Relative
Horizontal Movement
Horizontal TAB
Carriage Return
Backspace
Horizontal Position Absolute
Tabs
5Dot Column Coding
Dot Graphics
Sample Basic Program for Dot Coding
Line Feed NEL
ESC P Enter DOT Graphics Mode
ESC \ Exit DOT Graphics Mode
BEL Bell
Horizontal density Vertical density
Graphics Density
Ansi Bar Codes
Before You Begin Set the Form Length
0123456789
Setting Bar Code Parameters
General Rules for Assigning Parameters
Cancel OVERSIZED/EXPANDED/BAR Code Modes
Bar Code Command Sequences
Postnet
UPC-A
UPC-E
MSI
Element Widths
1234
P10 Horizontal Resolution
Delimiters
#/E !#/E
Horizontal Tab Delimiter
1234
2345 6789
= 2 x L1 L2
Calculating Characters per Inch
Interleaved 2 of 5 Style
Bar Code Style Characteristics
Matrix 2 of 5 Style
EAN-8 Style
Code 11 Style
Codabar A/t, B/n, C/*, D/e 9, 10, 11
UPC-E Style
Code 93 Style
MSI Style19
ZIP
ZIP+4
ABC
Bars per character 2 tall bars and 3 short bars
Calculating the Checksum for Code
Calculating the Checksum for Code 3
Code 93 Character Table
Code 93 Checksums for Full Ascii
Checksum calculation for the symbol Cat
DEL
Ascii
Ansi Oversized Font
Exit Oversized / Expanded / BAR Code
Control Function Summary
Oversized Control Functions
Activate Oversized / Expanded / BAR Code
SET Character Size
Exit Oversized
Oversized Versus Expanded
Setting the Expansion
ESC pvphSPB
Device Timeout with Very Large Characters
2Character Cells
What is a Character Cell?
3Vertical Character Dimensions
Oversized Character Dimensions 0o
Vertical Position-Relative in Oversized
Oversized Character Dimensions 270o
ESC PvPhf
Implementing the Line Feed Function 0o
Line Spacing and Intercharacter Spacing 270o
Appendix A. Commands and Exceptions
Commands not implemented in the 7265 Ansi Emulation
Programmers Reference
Table of Contents
Page
Page
Sorted by Sequences Sorted by Functions
Appendix B Character Sets
Description of Sequences
Introduction
Introduction
Ascii ESC C
Character explanation and symbol description
Ascii ESC
ESC NUL
Ascii ESC NUL
ESC C ESC C NUL
Data Structure Ascii
Paper and Text Formatting
Next L
Description Valid values
ESC C
Data Structure
Ascii
ESC c
Paper and Text Formatting
ESC N
ESC N ESC O
Example
ESC Q ESC l
ESC Q
Description
REM
ESC a
Width
Character Spacing
= INT
Following sequences will cancel the HMI mode
Ascii DC4
SO/ESC SO DC4 ESC W
Syntax
Ascii ESC SO
Character Spacing
Ascii DC2
SI/ESC SI DC2
Ascii ESC M
ESC P ESC M ESC g
10 REM Single character densities
ESC p
Ascii ESC SP
ESC SP
Line Spacing
ESC 0 ESC 1 ESC
10 REM Fix line spacing
Ascii ESC a
ESC 3 ESC a ESC +
Next END REM
Character Styling
ESC S ESC T
ESC S
Ascii ESC T
Lprint E=M*C
ESC G ESC H
ESC G
Ascii ESC H
ESC
Pitch
Following sequences are ignored in scaleable font mode
Following sequences will cancel the scaleable font mode
Points
DPQ NLQ
ESC
ESC k
OCR-B
OCR-A
Character Styling
Beispiel
ESC q
ESC E ESC F
ESC E
Ascii ESC F
Underline Mode
Type n2
Loc n1
Character Styling
ESC 4 ESC
Print Mode Selection
Stan Con Cond
Next N END
ESC w
Print Positioning
ESC D
ESC D
Ascii ESC D NUL
Horizontal tabs
ESC e
ESC f
Example for calculating n1 and n2
ESC $
Lprint
ESC \
Lprint END
ESC B
ESC B
Ascii ESC B NUL
Vertical tabs
ESC b ESC
Lprint CHR$11
Set Absolute Vertical Print Position
Set Relative Vertical Print Position
Print Positioning
ESC U
ESC Z
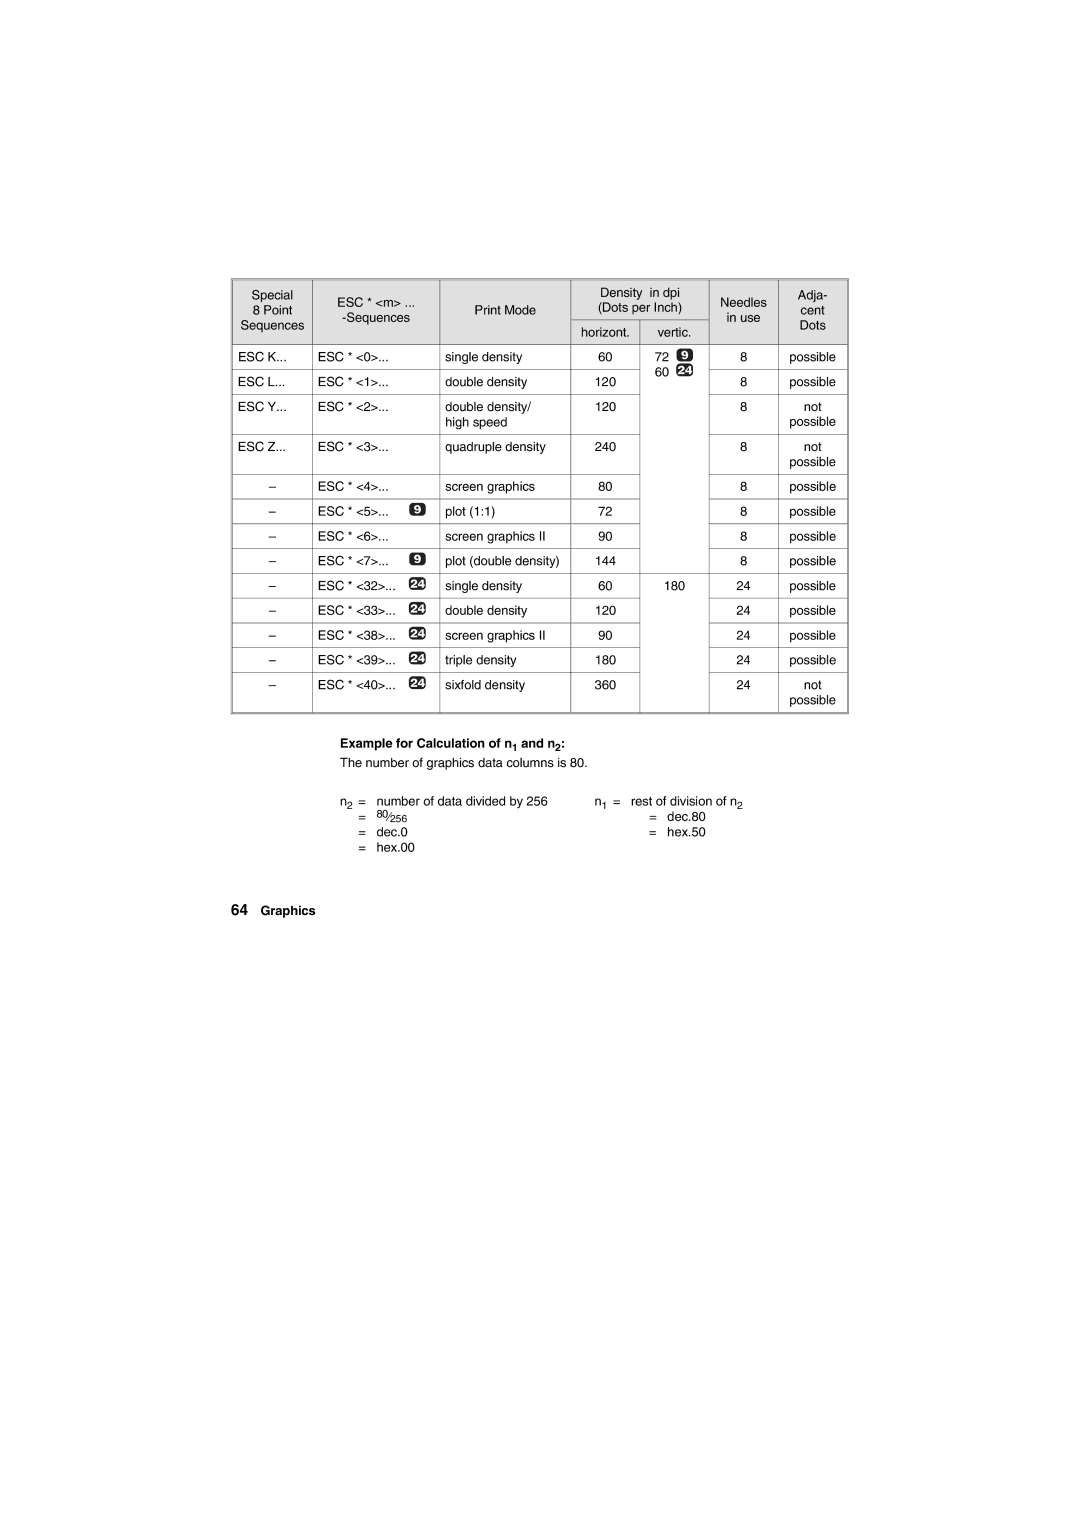
ESC K
ESC L
ESC Y
Example for Calculation of n1 and n2
Needle Data Byte
Graphics
ESC G
Graphics
ESC ?
For X=1 to 60REM
Graphics Printing with 9 Print Dots
Example for the calculation of n1 and n2
Download Character Generator
General
Download Character Generator
Copy ROM into RAM
Print Raster Graphics
Calculating algorithm
Description of parameters
Stop
SOH
ESC %
Download Characters
Columns
Defining Character 9 Needle Printer
Evaluation of the bytes in each column is as follows
Descenders 9 needle printer
Attribute a 9 needle printer
Computing the Attribute 9 needle printer
Proportional Data 9 needle printer
Download Character Generator
Download Character Generator
Lprint Lprint Lprint
Definition of NLQ Characters 9 needle printer
Definition of the Character Grid
See next page for the corresponding programming example
Read D
Needle printer
Example
Lprintlprint Lprint Aaaaaaaaaaaaaaaaaaa
Miscellaneous
ESC ESC U
ESC s
ESC J
ESC j
ESC J
ESC r
10 REM Colour selection
ESC R
ESC R
USA
Germany
D1 = 1 or Character table
ESC t
Restore
Brascii
Abicomp
ESC ESC = ESC #
Ascii ESC EM
ESC EM
REM sheet feeder
ESC 6 ESC
END Restore
ESC m
International Code Table
ESC @
ESC 8 ESC
Control Codes
Can
Hex.7F Clear previous characters in the print buffer Dec.127
Hex.01 Start Of Heading Dec.01 Hex.20 Space Dec.32 Hex.0B
Appendix a
2Summary of Possible Codes
Sorted by sequences
BEL Can DEL DC1 DC2 DC3 DC4
ESC % NUL
Summary of Possible Codes A-3
ESC =
4Summary of Possible Codes
ESC B NUL
ESC D NUL
ESC EM ESC EM R ESC F
ESC O
ESC SI ESC SO
Summary of Possible Codes A-5
6Summary of Possible Codes
ESC X FF HT LF NUL SI SO SOH SP VT
Summary of Possible Codes A-7
8Summary of Possible Codes
ESC #
Summary of Possible Codes A-9
ESC % NUL NUL
10Summary of Possible Codes
Appendix B
2Character Sets
Ascii B dec.66 hex.42
Character Sets B-3
Standard Character Set
4Character Sets
US Ascii
Character Sets B-5
6Character Sets
Character Sets B-7
8Character Sets
Character Sets B-9
International Code Table
10Character Sets
International Code Table, extended
Character Sets B-11
12Character Sets
Proportional width during scaleable font mode
Character Sets B-13
Needle Printer
14Character Sets
Character Sets B-15
16Character Sets
Character Sets B-17
18Character Sets
Trademark Acknowledges
Programmer’s Reference
Description of MTPL-Sequences
Page
Page
Page
Appendix C Additional Technical Description Index
Description of MTPL-Sequences
CSI ... t
Ascii CSI
Set to a form length of 72 lines
Data Sructure
CSI ... t
REM
CSI 11 h CSI 11 l
CSI ... SP
Examples
CSI ... r CSI r
For F=1 to For L=2 to Lprint
CSI ... s CSI s
10 REM Left and right margin Width LPT1,255
CSI SP
CSI ... SP U
CSI SP U
CSI 10 SP U
CSI 8 y CSI 9 y CSI 10 y CSI y
CSI ... SP G
CSI ... w
Character densities
CSI ... SP K
Character Spacing SCS
CSI ... SP \
CSI ... SP f
CSI ... p
CSI ... q
CSI ... SP L
CSI 4 z
CSI 3 z
CSI ... SP h
CSI 0 z CSI 1 z CSI 10 z CSI 2 z
Super/sub/microscript
CSI 12 z CSI 13 z CSI 2 z
END
CSI ... SP X CSI ... y
10 REM Print quality
CSI n1 n2 nx m Character Styling
CSI ... m
LQ OCR-A
LQ OCR-B
CSI = z CSI z
CSI n1n2nx m Example
CSI 3 m CSI 23 m
CSI 7 y
CSI 26 m
CSI 2 y
CSI 50 m
10 REM Proportional spacing
CSI 4 m CSI 21 m CSI 24 m
CSI 53 m CSI 55 m
CSI 9 w CSI 8 w
CSI ... SP C
CSI ... SP B
CSI SP B
CSI ... SP D
OCR B
OCR a
Parameter n1 Register to use
Parameter n2 What to put in the register
= OCR-B = OCR-A
Ascii HTS
HTS
CSI ... u ESC H CSI ... g
Examples
Next Lprint
Line Feed
Vertical Tab Stop
IND
VTS
IND
Ascii VTS
CSI ... v CSI 1 g CSI 4 g
10 REM Vertical tabs
CSI
Data Structure Description
CSI ‘
CSI ... a
CSI ... j
CSI ... d
CSI ... e
CSI ... k
CSI ... f
Backspace
Form Feed
PLU
PLD
PLU
PLD
NEL
NEL
ESC % CSI 6 z CSI 5 z
ESC Data
Data Ascii CSI
Example for calculation of n1 and n2
REM bit image print
Restore
CSI ... SP q
CSI ... + y
CSI ... + z
CSI Pn + w
CSI Ps1 Ps2 Ps3 Pn4 Pn5 +
Rgbk Ymck
Red Green Yellow Blue Magenta Cyan
Ymck Rgbk
CSI ... z
Gosub END For I=97 to 103LPRINT CHR$INEXT
CSI ... CSI 2 J
If a cutting device is installed
Paper is inserted on receipt
ESC c CSI 6 ~
CSI ? ... ~
Mtpl
Mtpl + Epson FX Mtpl + Epson LQ
SO ESC
LS3R
LS2R
Set of up to 94 characters is made ready for use
ESC ESC +
US-ASCII
UK-ASCII
Miscellaneous
Lprint US-ASCII Gosub
Activation of Characters
Graphic description of locking shift/single shift pages 81
CSI ? 50 l
CSI ? 50 h
CSI ? 52 h CSI ? 52 l
CSI ? 51 h CSI ? 51 l
CSI Pn … SP r
CSI ? 53 h CSI ? 53 l
CSI ... c
CSI ... n
ENQ
Ascii ENQ
= Busy
NUL
STX
STX
ETX
ACK
Ascii ETX
NAK
Can
NAK
DEL BEL
Ascii DEL
Ascii BEL
MTPL-Start Character Control Sequence Introducer
Start Character Escape
Appendix a
Function Sequence
Summary of Possible Codes A-3
CSI 2 SP L
CSI 2 J
CSI 2 SP
CSI 2 SP K
CSI 7 SP
CSI 4 SP
6Summary of Possible Codes
ESC * F
ESC + F
ESC ~
CSI 5 SP
Summary of Possible Codes A-9
CSI 0 SP
CSI 0 SP K
CSI 1 SP K
Summary of Possible Codes A-11
CSI 1 SP
12Summary of Possible Codes
Summary of Possible Codes A-13
Appendix B
For the contents of the shaded areas, see table at page B-3
International Substitution Table normal font
Programmer’s Reference
HRI
Data Formats of Barcode Types
Codabar
EAN Upca Upce
Check Number Calculation
Appendix
Page
Barcode and LCP Printing
DLE
SUB
Please note the following explanatory information
Matrix Type a
Figures n Start code Stop code
Character explanation and symbol descriptions
Special Feature
ESC PSC0 ESC \
Unsecured mode
Secured mode
Secured/Unsecured Mode
Lprint CHR$27
Barcode Printing
Barcode Printing
LCP commands
Selection Code
HRI
Header Parameter Normal Compressed Enlargement Factor
EAN/UPC Barcode X, Y = unregarded
Barcode Printing
Code 2/5 Matrix Type a
Code 2/5 Industrial Type B
Not 398 but
Code 2/5 Interleaved Type C
Figures/Characters n Start code Stop code
Code Type D
Code BCD Matrix Type E
Code Type F
Type G
Codabar
Hex Start code Nnnn Separation code Nnnc Stop code Dec
Code EAN 8 with HRI Type H
Code EAN 8 without HRI Type
Hex Start code Nnnnnnn Separation code Nnnnnc Stop code Dec
Code EAN 13 with HRI Type K
Code EAN 13 without HRI Type L
Code MSI / modified Plessey Type M
Separation code Nnnnnc Stop code
Code UPC a with HRI Type N
Code UPC a without HRI Type O
Hex Start code Nnnnnnnc Stop code Dec
Code UPC E with HRI Type P
Code UPC E without HRI Type Q
Code Delta distance IBM Type R
Code Type S
Example
Wert
Code 128 translation table
Barcode Printing
EAN Type T
Add-On Barcodes
Barcode Printing
EAN
Check Number Calculation
EAN
Add-On
Upce
Numbers are transmitted check number c and 2 informations n
US Postnet Barcode
US Postnet Barcode ESC 1 SP p
Large Character Printing LCP
Large Character Printing LCP
Hex Dec = all printable characters hex.1F, dec.31
ESC \ Character set US-ASCII Hex Dec
Various Examples
Various Examples
END
Various Examples
Appendix
Ascii B = dec.66, hex.42
LCP Character Set, german
LCP Character Set, US-ASCII
OCR-A Character Set Code
OCR-B Character Set Code