Tektronix
Page
O o o o o o o o a o O o o o o o o o o
Releaseof Copyright
O o
O o o o o
O a a o o o
O a o o A a a a a
O o
Warranty
O o o o o
A a a a A o a o o a o o
A o
494A/494APServiceVot.1
O o
A o o
A o o o o o o o
O a o o o a o
O o o o o o o
494A/494APservice Manuatis divided into two volumes
O a
CONTENTSGonr
O o o
O a o o o
O a o o o
O o t
A a o o o a o o
O o a o o o
O o o o o o
O o a o A o o o o o
Powersupply
O o o o a o
A o
RAM
VOLUME2
494A/94APServiceVot.1
O o o o
O t
494A/494APServlceVol
Preselector P3035on theVideoProcessorboard Rejection
494A/494APServtceVot.1
A o O o
O o o
Simplifiedschematicof harmonicmixer
Basicblockdiagramof a -rNsynthesizer
494A/494APServlceVot
Simplifieddigital-to-analog Converter
O o a o
O a o
O o o
944/494AP Service Vot
SpEctFtcATloNs
Options 22 Waveguide
MtxERSCHARACTERTSTTCS
Do Not ServiceAlone
O o o o
O a o
This Manual
O a o o o
A o o o o
Sedon 1 4g4l494Ap Servlce,Vol
Value.
O a O o O o o o
SEL
Mlxer 18to 26.5to 33 to 490U 40 to
WM 49OV
WM 490E 490W
10to 170GHz
O o A o
Electricalcharacteristics
O o o o
O o a o o o o A o o o a
Freouencyrelatedcharacteristics
+tAF. x BEF + 20 + 4NHz
Characteristic Performance Uirement
Normal Accuracyand Ldentical Resolution
Resolution FrequencySpan/Div OverallRange MinimumSpan/Div
KHz 300 Hz 30 Hz 3Hz Typically 30 psldivision of pulse tude
Freq
Freouency Relatedcharacteristics
E o o
33-s0GHz
O o a e
O a o s
Accuracy Steps 10 dB/divLogMode
Accuracy Normal or Delta Mode
ReferenceLevel SEt With Data ENTRYpush Buttons
DisplayDynamicRange Accuracy
RF Attenuatol Range Accuracy Dcto 1 GHz
Delta a Mode provides differential
Performancq Requirement
DecadeTransitions
100 DBc
Amplitude
C o
A07-100
Inputsignalcharacteristics
Externalmixer
O a o e
O o o a
Speclfication- 494Al4g4ApService,Vol
J104 ACCESSORy Pin4 Pin5
1stLO OUTPUTpower
UalrbratorcAL ouT
Outputsignalcharacteristics
Teristics
O a o o
Line
Speclfication- 494A1494APService,Vot.1
Temperature Operatingand Humidity
CE03-15 kHzto 50 MHzpowerleads
CS02-50 KHz to 400 MHz power F u l l l i m i t Leads
SrDEvtEw
O o o o o o o
15.05 28.85inches232x 392x 732.gmm
O c o A a o o
Unpackingand INITIALINSPECT6N
494A1494ApService,Vot
O a o o o o o a o o A o a o o o
Connectingpower
PowerSourceand power Requirements
Installation- 494A/494ApServlce,Vol
O o o A o o o o o o o
O o o o o o o
O o o o o a o O o a o o o o o o
O o a o o o O o o o o o o o O c o O a o o
Secton 4g4Al494ApServiceVol
O o o o o o o o o o o o o o o o o o o
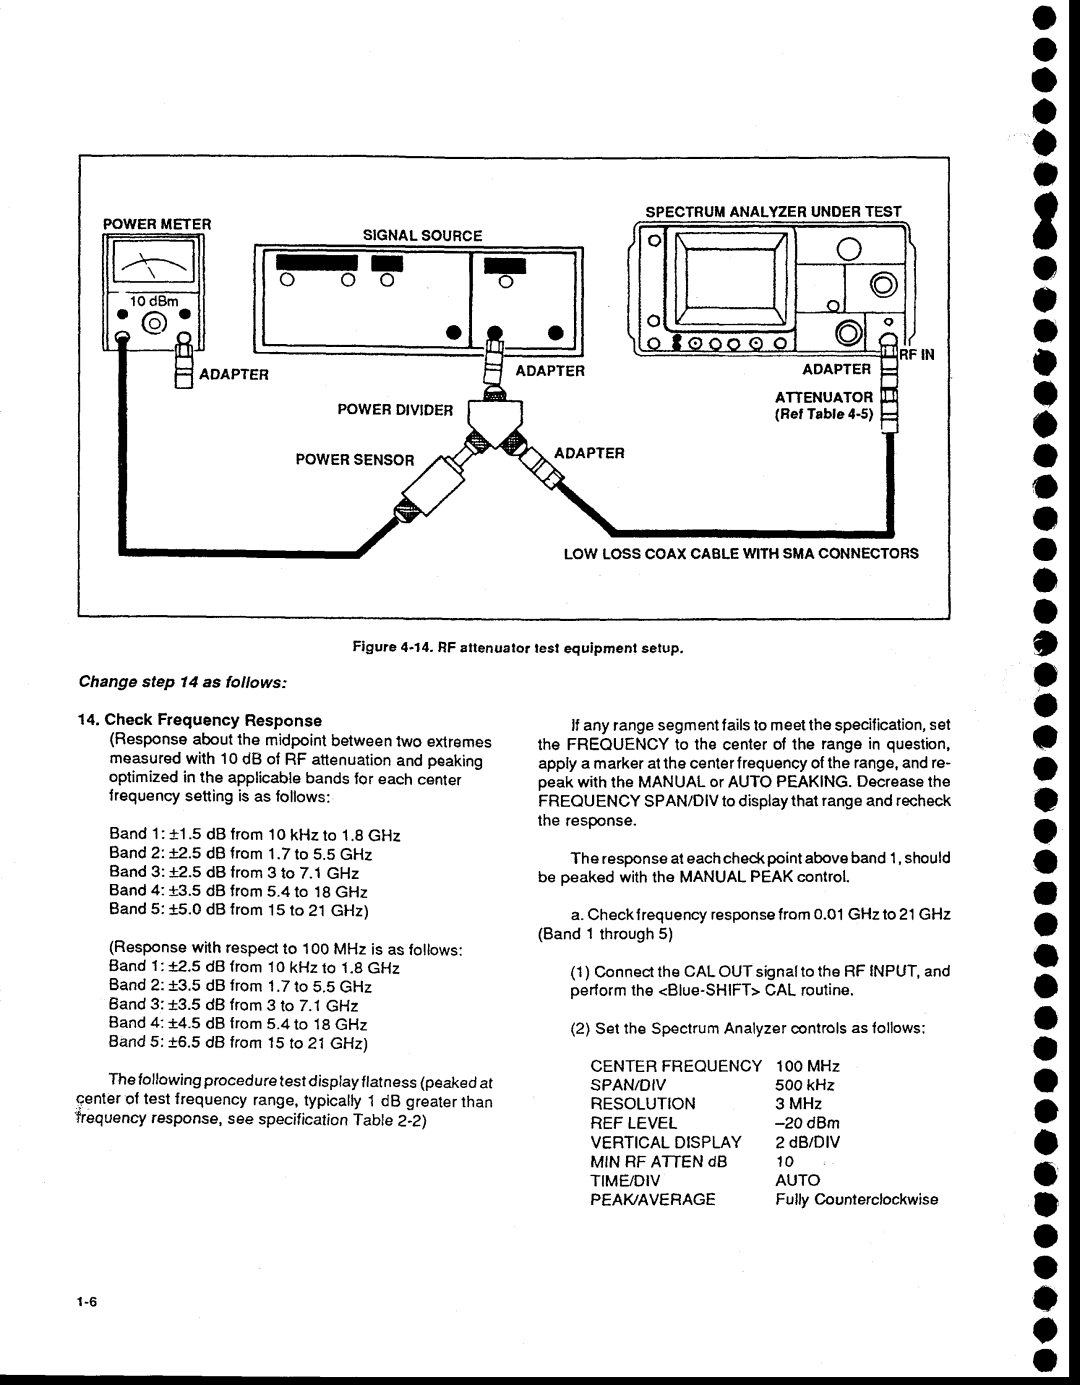
Eouipmentreouired
O o o o o o o o o o o o o o o o o
O o o o o o
O o o o o o o o o o o o o o o o o o o o
Accuracy*0.2s dB io
LodB/soolttffi LrlrGtr
Eouipment Reouired
Preliminarypreparation
MAX 10DB/ 2ODB
PerformanceCheck procedure 4g4Ll4g4ApServiceVol
O o o o o o o o o o o o
TrME/DrV
Performancecheckprocedure
O o a o o a o o o o o o o o o o o o o o o o o o o o a
O o o o a o o a o a o o o
TIME/DIVAUTO
SPAN/DIV
TME/DV Auto Vertcaldtsplay
O a o o o o o
A a o o o
A a o o o o o o o a o o o o o a o o o o o
Center Freouencyaccuracycheckpoints
O o a o a A a o o o o a o o o O o a o o o o o o a o
CheckCenterFrequencyStabilitv
Autoresoln on
Verticaldtsplay
Resolutionbandwidthauto
O a o a o a o a a
O o a o o o o o o a o o o o o a o o
TME/DVAUTO
SPAN/DrV
TlmeMarkGenerator
MarkerOutput
50 Hz 20 ms
O o a a o o o a o a o a a o o a o a o o o o
O a o a o
Autoresoln Reflevel
10dB/Dtv
A o o o a o o
A o a o o o a
A a
TimeAccuracy C.**qyegp WithinS%oftherateserecitJi
CheckResolutionBandwidth and shape Factor
O a a o a o a
O a o O o a o A o
Minnose
Qlglptv to 50Hz, andVERlCnl.drdpr-ry
O o a o a A o o o o o o o o o o O o o o o
A o o
SPAN/DV
MIN RFATTENdB
Nro sMAooaeten
LowLosscoAxcABLEwrrx sul courEEroid
0 GHz
7.4 GHz 9,4 c
A o o o o o a
O o a o o A o
O o a a a
A o a a a o a o o a O o o o
Narrow Videofilter PEAK/AVERAGE
O o a o o o A o
Tmeidivauto
Part
Narrowvideofilter TME/DV Auto PEAK/AVERAGE
PerformanceCheckprocedure- 4g4Al4g4ApServlceVol.1
O o a
TrME/DtV
Testsettings
O a a
Vertical
Display 21BIDIV
Narrowvtdeofilter
TIME/DIV Auto
15.RF attenuato. test equipment setup for 50-60 dB step
O o O o a
A a a o a o
Centebfreouency
Display
Widevideofilter
DB/Dtv
O a a o o o o a o A o o o o o
A o a
O o a
O a a
12s
103 Trr
Freorange
PerformanceCheck procedure- 4g4A/4g4ApServiceVol
Resolutionbandwidth 100 kHz
O a
CheckLO Emission -70 dBmor tess
Autoresoln
Otsplay
PerformanceCheckprocedure- 4g4Al4g4ApServiceVol.1
18.Test equipmentsetuplor checklngharmonicdistortion
@o@o@g@@
EXT
PerformanceCheckprocedure- 4g4A/4g4ApServiceVol. l
Resolutton
Bandwtdth 1 MHz
Verticaldisplay LIN Triggering INT TIME/OIV
TME/DV EXT
Vertcal
Dtsplay 2 dB/DtV
Rrttl
Optioninstruments
I3fil l t r l
CheckHORIZOUTPUTSignatLevel
MAX Hold
Spanidiv
Dtsplay
Verttcal
Tmeidiv Auto PEAK/AVERAGE
Comb Generator Mooule
Q15oit riline
Ull
TR5O2
OutputLevel -dBm Var dB Dot Intensity Off
A o o o c
Gpibverificationprogram
O o o o o o o a o
Return
Return 5OOOREM49XPGPIBVERIFICATION Program
5O9OINPUTT$
O a o a o r
8070INPUT
8100PRINT
9040PRTNT10OMSGEOS
1OO1OPRINTSELECTEDDEVICE-CLEAR...SDC
A o o
O c
16000REM Talkonlymode 16010PAGE
16050PRTNTTALK Jtestng only 16060INPUT
Onlymode Fail
ANDRENREMorE
JGPIBvERlFlcArtoH Cotapr-erEo
JJLrsrEN!TALKTLF OCrnoiness
Message
O o o o o o o O o o o o o o o
19300cosuB19390
Generator
19530REMFAILUREDECISION Handler 19540PRINT!SELECT a UDK
Stancdischarge
Can Damage
Semiconductor Many Componentsused
Thisinstrument
Adluctment Procedure- 4g4A/4g4ApServtceVot
A a o
Preparation
7lu
Selectorswttch
Adjustment Procedure- 494A/494ApServiceVol
O o o o o o o o o o o o o o o o o o o
O o o o o o o o o o o o o o o o o o o o o o o o o
O o o o o o o o o o o o o o o
Rrqm
TIME/DIV MNL
AdJustmantProcedure- 494A/4g4ApServiceVot. .l
TIME/DIVAUTO Triggeringfreerun
Adiustment Procedure- 4g4Al4g4Ap ServiceVol
Test equlpment setup for adiusting the D€flection Amplifier
Triggering EXT
Adfustment Procedure- 4g4Ll4g4ApServtceVot
O o o o o o o o o o o o o o o o
AdJustmentProcedure- 494A1494ApService Vot
O o o o o o o o o o o o o
O o o o o o o o o o o o o o o o o o o o o o o o o o
OuFur GarnR1033 nrors
O o o o o o o o o o o o o o o o o o o o o o
Adjustnent Procedure- 4g4A/4g4ApServtceVot
O a o O o o o o o o o o
Adjust Log Amptitier
=?l
RPlo3s-.8
R1012 R102S,R1030
AdrustmentProcedure 4g4Ll4g4ApServtce Vot
@o.@@GPt
O o a o o o o o o o a o o o a o
Filrcsotocr
Adjustment Procedure- 494l4g4Ap ServiceVot
A o o o a o o a o o o o o o o o o o o o
AdJustmentProcedure- 4g4l4g4Ap Service Vot
O o o o O a o o o
A a o A o O o o
LNorE-l
O o a o o a o o a a o o o o o o o o o o o o o o
O o o o o o o o a
SETTTNGS2
Rcsct
Tion Bandwidth
Tionbandwtdth
$o o3 $o
O o o o a a
O o a o a o a
O o o o o a o o o a o a o o o
OotHi
O o o o O o o o o
Ai kHr
O a a a a o o o o a o o o o o o o o o o o
O a o a o a o o o
MIN RF Atten
Triggering Auto
Adjustment procedure 4g4Al4g4ApseMce vot
O a o o O o o a o
Frequencyrange
OTi#i
O o a
AdrustmentProcedure- 4g4A/494Ap
Rplo?2/h
R1OS4 Frequency
To 3.0-7.1 GHz, set
AdfustrnentProcedure- 4g4A/4g4ApServtceVol
Ot o
A o o o
AdJustnentProcedure- 494A/4g4ApServtceVot
A o o o o o a
Lt. a o o a o O a o
@@r
Snrnasrzen @
Rpzoro
O o o o o A o o o o
AdjustOption0Z VR BandLevetino
Optioninstruments Only
RFouT OUr
AdrustmentProcedure- 4g4A/4g4ApServlceVot,I
O a o a o o o o o
Relativesusceptibilityto Staticdischargedamage
Introduction
Sectfon6 494A/494ApServicc Vot.1
Maintenance- 4g4Al4g4ApServlce Vot
367-028s,00
TroubleshootingAids
Maintenance- 494A1494ApServiceVol
Page
Diagnostics
Troubleshooting Using Theerrormessagedisplay
TUNINGFAILURE- 2NDLO
Powersupplyoutof Regulation
TUNINGFAILURE- 1STLO
O a o a o
Malntenance- 494A/494ApServlceVol
TPl034 GroundRefer€nce
Desired
Mixerfreo
1STLO Setnngaccuracy
Auxiliary Synthesizer
O o o o o o O o o o o o a
2NDLO Controldiagnosttca
Offset SET.540.672KHZ Ting Accu Racy
PHASELOCKFAILURE- 1STLO
Lockdisabled Press Help Enable Pressshifttoexit
Enabledpresshelpto Disable
Strobefreq
O o a o e
Shift Pulsestretcher
Malntenance- 4S4Al4g4ApServtceVol
O o a o a
Tracemodes
Corrective Maintenance
Maintenance- 494Al4g4fupService Vof
Selectedcomponents
1R1020
A46A1Rl015 446A1Rl010
O o o o o a o o o o o o A a
SERvIcING TooLs FoRBoARDTffi3.i*,o= MouNTEDcoMPoNENTs
Mafntenance- 494l4g4Ap ServtceVot.1
HorAlr HepairTerminal
O o o O a a
Maintenance- 494A/494ApServtceVot.1 Diode Color Code
O o c a o o
O o E a o o o c o o A o o a o a o o
Replacingassembliesand Subassemblies
O o O o o o O o c o o o o a
A30A57-GPIB Interface
LlrxER
Maintenance- 494Al4g4ApServiceVot.1
Sr3- ltI
O o o o o o o o o o o o o o o a o o o o o
Page
Main PowerSupplyModule Removal
EAUloNl
@o @@tr\
UpJ
Maintenanceadjustments
O o a o o o o o o o o o o O o o o o o o o o o o o o o o o
O o o o o o o o o o o o o O a o o
Malntenance- 494A/494ApServiceVol
Eouipmentrequiredforreturnlossadjustment
A o o o o o o o o a o O o o o o o a o o o
Mafntenance- 494A1494ApServtceVot.1
O o a a o o o o O o o o o o o o o o o o a o o
829lr/lHzCoaxial Band-passFitterAdjustment
O a a o a o o a a a o a o a o o o
O o o o o o o o o o o
O o o o o o o o
Maintenance- 494l4g4Ap ServlceVot
O a o o O o o o o a o o o o o o o o o o
Malntenance- 494A/4g4ApServiceVol
O o o o a o o
O o o o a o o
17.Corect re3ponsetor g29 MHr tlrlrd and fourth resonators
O a o o
O o o o o o o o a o o
O o o o o o o o o o o
Calibrated100 MHz.with +20 kHz accu
Lr.fry- gllpin . DoNorposinouexy op
O o a o o
A o o O o o
Maintenance- 494A/4g4ApServtce Vot
Ffiffi
Maintenance- 4g4Al494ApService Vot.1
O a o a o a o o
A a o a o o o
Mafnfenance- 4g4Ll494ApServtceVot.1
O a a o o a o o
A a o a o o o o o
Maintenanco- 4g4A/4g4Ap ServlceVol
R404OFine TuneRanee
O a a o o o a o a o o
O a o a
A o o
FREOSPAN/DV MAX
O o o a a o o
Malntenance- 494A1494ApServtceVol
Start Spur Amplttude
Capableof measuring0 Ogmit 2 t\,tt-tz
FREQSPAN/DIV MAX Autoresoln on
O o o o a a o
FREQSPAN/DV MAX
Range
FREQSPAN/DIV MAX Autoresoln Reflevel
Minrf Atten
Timeidv
F t
HhFr $ f
Malntenance- 494A/494ApServlce Vol
Malntenance- 494A/4g4ApServiceVot
A o O o o o a o o a a o
Ll,l
Jdl tt
Maintenance- 494A/4g4ApServtceVot.1
Settings
A a
O o o o a
O a
AddressBusTest
C o o o O o o o o
O o o o o a o
SwtTcH
Maintenance- 494A1494ApServiceVot..t
0xxx U302s
Troubleshootingon Instrumentbus
Maintenance- 494A/494ApServtceVol Instrument Bus Test
O o o o o a o o
Yr iffiI
ADDRinstrumentbusaddresscommand
Responseto ADDRquery DATAinstrumentbus data command
CombinedADDRcommandand DATAcommand
Malntenance- 494Alttg4ApService Vol
DATAinstrumentbus dataquery
InstrumentBusRegisters
X x x 0 0 X x x 0 1 X x x 1 0
Instrumentbusregisters
DB7-DBO
DB3-DBO
O a o A e
Rfinput
DBO DB5-DBO
Extmixer
DB7-O DB3-DBO
O o o a a
DB2
Vco
LSB
DB6 DB2 DBO
DB2-DBO
Front-PanelRegisters
OFF
Maintenance 4g4ful4g4ApService Vol
Tapedatatransferprogram
O o o a
E o
A o o o A o o o a o o
Finished
O t a
O o o o a o
O o o O o o o a
O o t O o o a a o O o a a o o o a o a o o o o a o o
O o o o O o o a o o o o a o o o o o o o o A o o
Rollow
Secton 494A1494Ap Service,Vot
Pr signals. Blockdiagrams Showingmore
O o o o O a o o a o o o o o o o o o a o o O o o o o o
Page
RF InterfaceCircuits Diagram28
Lst ConverterDiagram12
RF Input TheRFINPUT50 connectoracceptstheinputsig
O o o o o o o o o o
O o o o o o o o o o o o o O o o o o a o o o o o o a o
Andpassesdtttreiueniy oro
Page
O o o o o o O o o o o o o
Theoryof Operafon 4g4A/494ApServlce,Vot
Tabte7-1
2NDCONVERTERIF Selection
2472MHz2ND CONVERTERDiagram12
O o o O o o a o o o o o o o o
O o o a o o o o o o o o o o o
CAvrrYPosr+l+
Theory of Operaton 4g4A/4g4ApService, Vol. .l
Ou-Too---l
Precision
ExternalCabtes
2182MHz PHASELOCKED2nd LO Diagrams13
O o o o O o a o o o o O a o O a o o
O a o O o O o o o
O a o a o o o o o o o o a o o a o o
Vco
MHz 2nd Converter Diagrams15
O a O o a o
O o o o o o o a o o o a o o o
A o a o
O o a a o o o
Switchandamplifier
A o a o o o o o o
Otr
829MHz2nd Conv
O o a a a o o o O o o a
Page
O o a a o o a o o o
O o a a o o o o o
A o o a
110MHztF AMpLtFtERDiagram17
Theory of Operation 4g4Al4g4ApService,Vol
110MHzFTLTERS Diagram17
3rd CONVERTERDiagram17
A o o o O o o o O a o
A o o o o o o
REFERENCELOCKDiagramS0
O o o O o a o O a o
O o A o o o o o o a
VariabfeResolution Diagrams19, 19,104Id,and
Bandwidthselection
A o o o o o O o o
A a o o o o
O o O o o
BandLevetingCircuitDiagram20
GalnRequired
A o o O o
LOc AMp and Detector Diagram22
Fn9 input signat.at a nominal14 dBm, is applied
O a o o a
316
0316
316 684
O o o
A a o o
Theory of Operation- 4gA/494Ap Servtce,Vol
Theoryof Operation- 4g4ful4g4ApServtce,Vot
VIDEOAMpLtFtERDiagram23
Functionaldescrtption
Theory of Operaton 494l4g4Ap Servlce,Vol
12. Selecdon ol display positlon on lhe log scale
VtDEo PROCESSORDAGRAM24
Theory of Operaton 4g4Al4g4ApService,Vol
Ffi rffi
O o
C3026
C2016
Filtercomponentcombinations
DB2 DB3
DlclTAL STORAGEDiagrams25
Sytemis desisncto opn IT,r-.,.P.,9?
O o
LI l
Theory of Operadon- 4g4N4g4Ap Servtce,Vot.l
Page
O o O a o o
O o o o o
O o o o o o a o o o
Theoryof Operafon 494A/4g4ApServlce,Vol
O o e
O o a a A o a a o o
Clisplayappearsas a bright dot sweepingacross
DEFLECTIONAMpLtFtERSDiagram27
500 digitalstoragesweep positions. The resulting
O a o o O o o
Axisand RF Interface DTAGRAM28
Enables Currentdrivers
Transferswitchdriver
O o O o o a o o A o O o o o o o o o O a a
MHztF high Stateor F829 MHzlF towstate
O o A o O o o o O o a o
HTGH,VOLTAGESUPPLYDAGRAM29
O o o o o O o o o o o o
CRT READOUTDAGRAM30
Lf BLANKMSBof the characterdatais not set,the
GEN RUNNTNGflip-flopunassertsR/o oFF throughoR
Theory of Operatlon 4g4A/4g4Ap Service, Vol
Theory of Operation- 4g4Ll4g4ApService,Vot. l
O o o o o o o o o o o o o o o o o o o o o o o o o o o o
Zo-cou I lF-€
OFFTME u1055-d
X x x x x x
X x o o o o o
X o o o o o
X . o o o o o
O o o o o o o o o o o o o o o o o o o o o o o o o o o o o
Theory of Operation- 4g4l4g4Ap Servlce,Vol
Oe o
\i o
Address of Ascii code Skip bit Blank character
58O
O o o a o o o o a O o o o o o o o O o a
Theory of Opera$on- 494l4g4Ap Servtce,Vol
A o o o a o o o o o O a o o o o o a o o
SWEEPDiagram31
Theory of Operaton 494A/494ApService,Vol
D4 D3 D2 D1 do
A o o O a O a o o o o o o o o
20ssldiv 100
Theory of Operation- 494A/494ApService,Vol Tabte7-12
O a o o a o o o a o o o o o
Triggerselectionmodes
TriggerMode Freerun Internal Ext€rnal Line TableZ-13
A o a o o o o
O a a o a o
A o a o A a o o o o a o o o o o O o o o o O a A o o o o o o
SPANATTENUATORDiagram32
A o A o o A o o o o a o o
Calibrationcontrolselectioncodes
Theory ol Operaton 4g4A/494ApService,Vot
20k
1st LO DRTVERDiagram33
O o o o a a a o o A o o a a a
Xl K3065 x0.1 K3075 x0.01 K4072
X0.01
DB7
O o a o o o o o O a a o a O o o o o o o o o o a
DB4
O o a a o o o A o
Preselectordriver Diagram34
A o
O o a o a o a o
O o a o o o o o
U5031OUTPUTLINES
Span Volts Span Volts
Preselector Freouencybands
Theory of Opera0on- 4g4\l4g4Ap Servlce,Vot
TabteT-18
A o a o o o o
Centerfreouencycontrol DIAGRAM35
O o A a a a o O o o
O o a O o o
Figure Z-2S. DAC Varlance graph
Theory of Operaton 494l4g4Ap Servlce,Vot
O o O a o o A o
Ruooeour
O o o a o
ADDRESS70 Formats
O o a o o o a o
C o a o O o o o o o o o
Functionaldescription
Theory of Operation- 4g4ful4g4ApService,Vot
O o o O a a
HARMONICMIXERDiagram36
Theory of OperaUon- 494Al4g4ApServtce,Vot.1
AUXILIARYSYNTHESZERDiagram37
O a a A o o
Theoryof Operation- 4g4A/494ApService,Vol
O o o o o O a o o o o o a A o
Page
COUNTERBOARDDiagram38
Phaselocksynthesizer Diagrams39
O o o o o e
O e o o o o o o o o o o o
O o o a
U2025OUTPUTLINES
O e o o a o o o o o o o o o
Page
DIGITALCONTROLDiagram9
Theory of Operation- 494l4g4Ap Service,Vot
Theory of Operation- 4g4Ll4g4ApServlce,Vol
30. System memory map
Theoryof Operation- 494A/494ApServlce,Vol
31. UOaddr€ssspace
Theory of Operation- 4g4hl4g4ApService,Vol
O o c o
Page
Bit
A a O o O o o o o o o a o
Pollbits
A o A a o
O o a o o o o o
Lunr
A a O o o o o
Ff nsrrrcrr qrs crccr
O a o O a o o o o o o
A a O a o o
O a o
O o o o O o o a o A o o
O o o o o o o o a o o o o o o o o
O o o o o o o o o a o o
100
101
CoL
102
Main power Supplyfurnishes all the regulated
O o o o a o O o o o o o o
103
Theory of Operation- 4g4A/494ApServlce,Vol
Theory of Operaton 494A/494ApServtce,Vot
O a o o o o o o o a o o o o o
O o o o A o o o o o
Oenanon*l
105
Theory of Operation- 494l4g4Ap Servlce,Vot
Theory of Operation 4g4Ll4g4ApService, Vot
106 +5 V Voltage ReferenceSupply
O o o o o O a a o a o o a a a o o o a o
Determiningcomponents 107
Page
Swtss
Opl ONs
RcV/134
O a o o o o o o o o o O o o O o o o
CalibratorOutput cALOUT
A o o o o o o o
Freouency
O a o o a o o o o o o o a o o o o o o o
O a o O o o o o o o o o o o o
O o o o a o o o A o A a
Goesanoffi
Symmetry
OoultnGffi
A o o a o o
Vtdeoimarker
A o o o o a a o o o a o o o o
Generalterms
Gfoesary- 494l4g4Ap Service,Vol
O o o o o o
Frequencyterms
Amplitudeterms
A o a o o
Digitalstorageterms
O o a o o o
O a a o o a O o o o o
Revisioninformation
Manual Part No G556O-00 Flrst prtnilng JAN1987 Revleed
O o a a o a o o o o o o a o o
O o o o a o
12s
SENSmVTY
Instrument
O o
O o a o o A o a o
Efr/sN
O o o A o a o o O o o o o o o
O o O o o o
Product see llst Dale2-22-88
Chg. Ref M63911
DeflectionAmplifiertestpointsandadjustments Page5 ol
Productsee llst
O a o o o o o o o o
Instrument Manual
Performance Checkprocedure
O o o o o O o a
A o o o O o O a a
Instbument Partno
ADD
O o o o o O o o o a
Date 5/u9o
Perfrmanceheck pRocEDURE change stepr r as foltows
Product494N4g4Ap ServiceVol
O a o o o
ServiceVot.1
O a o o o o
Date 6/1190
Product494N494Ap
RHI
LO0
Vehticaldisplay
Peaiaverage
+i\
+ \
Resolution Verncal Freouency Bandwidth Display Spaivdiv
MHz DB Bandwidth
MHz 10dB 100kHz
DB Bandwidth Limits 60dB Measured
Resolutionbandwdith
Parti
Minnoise Verticaldisplay
Narrow Videofilter TIME/DIV Auto Peaivaverage
A a a
Peavaverage
Specification
Tercfgnix CHANcE INFoRMAnoN
PerformanceVerification
Check1 dB Compressionpoint
FREQUENCYSPAN/DIV 1 MHz RESOLUTIONBANDWTDTH1 MHz
Product SeeLlst Date11
SpectrumAnalyzerUnder Test
Ref. C1-991
A o a o o O c