Network Testing with the FrameScope Pro | 2 |
Viewing Statistics
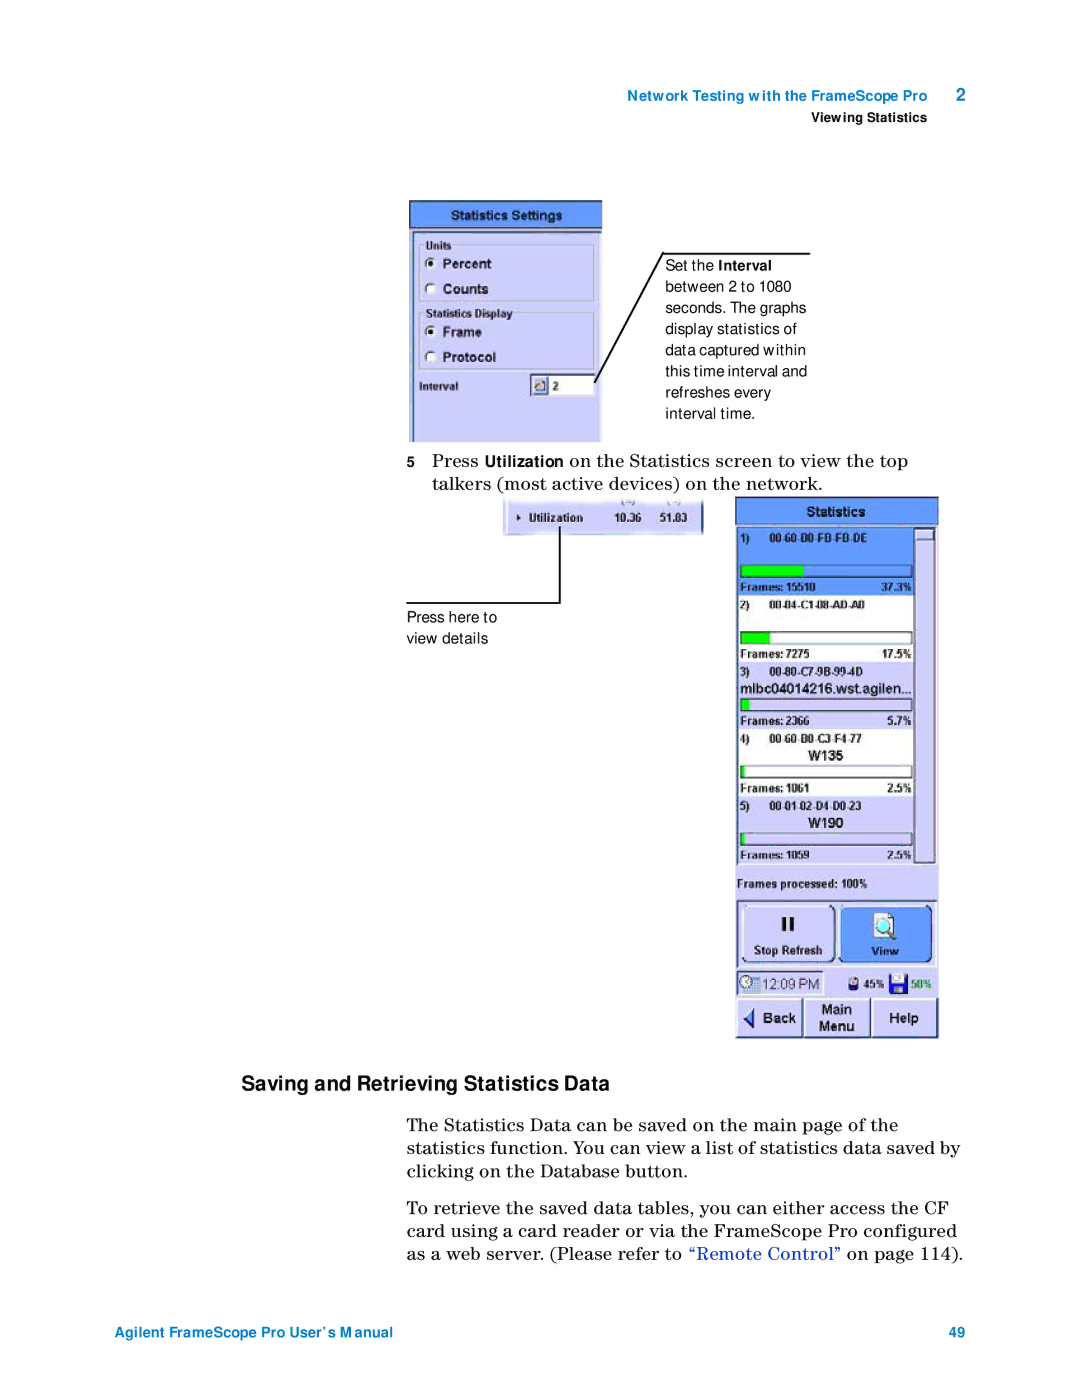
Set the Interval between 2 to 1080 seconds. The graphs display statistics of data captured within this time interval and refreshes every interval time.
5Press Utilization on the Statistics screen to view the top talkers (most active devices) on the network.
Press here to view details
Saving and Retrieving Statistics Data
The Statistics Data can be saved on the main page of the statistics function. You can view a list of statistics data saved by clicking on the Database button.
To retrieve the saved data tables, you can either access the CF card using a card reader or via the FrameScope Pro configured as a web server. (Please refer to “Remote Control” on page 114).
Agilent FrameScope Pro User’s Manual | 49 |
