5Network Performance Analyzer Reference
Statistics
Statistics
The first view into statistics provides the overall network health. The operator can drill down into the statistics to get more and more detailed information. Some of the more detailed information is gathered by software that may not have enough bandwidth to process 100% of the frames. So a value is presented for the percent of frames processed in these cases.
Overall Statistics
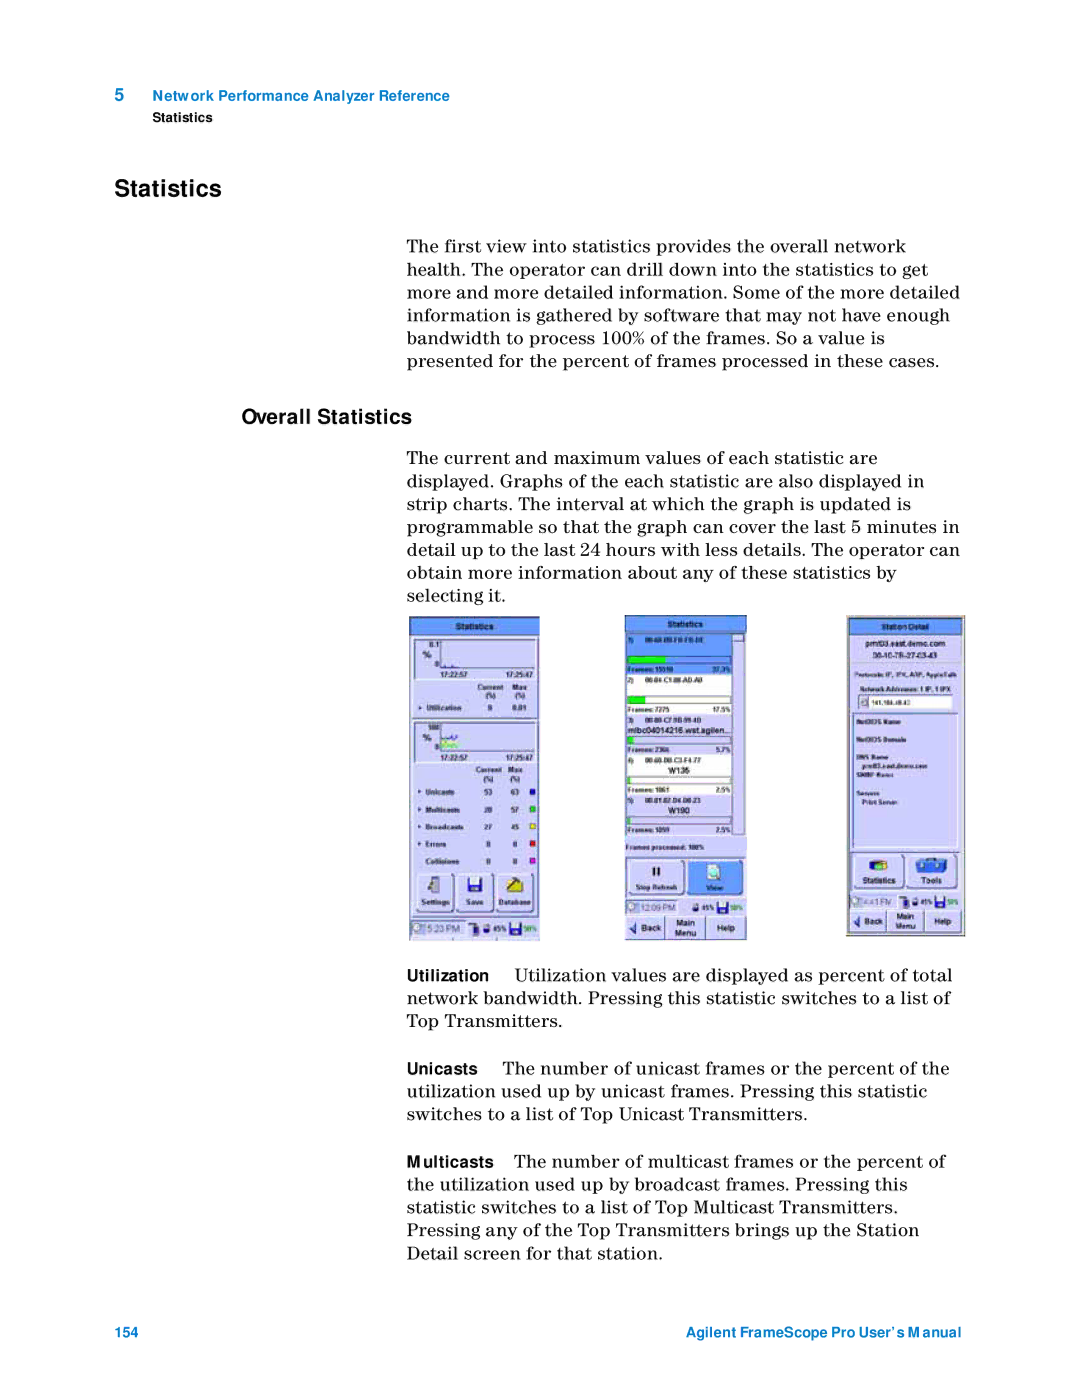
The current and maximum values of each statistic are displayed. Graphs of the each statistic are also displayed in strip charts. The interval at which the graph is updated is programmable so that the graph can cover the last 5 minutes in detail up to the last 24 hours with less details. The operator can obtain more information about any of these statistics by selecting it.
Utilization Utilization values are displayed as percent of total network bandwidth. Pressing this statistic switches to a list of Top Transmitters.
Unicasts The number of unicast frames or the percent of the utilization used up by unicast frames. Pressing this statistic switches to a list of Top Unicast Transmitters.
Multicasts The number of multicast frames or the percent of the utilization used up by broadcast frames. Pressing this statistic switches to a list of Top Multicast Transmitters. Pressing any of the Top Transmitters brings up the Station Detail screen for that station.
154 | Agilent FrameScope Pro User’s Manual |
