2Network Testing with the FrameScope Pro
Viewing Statistics
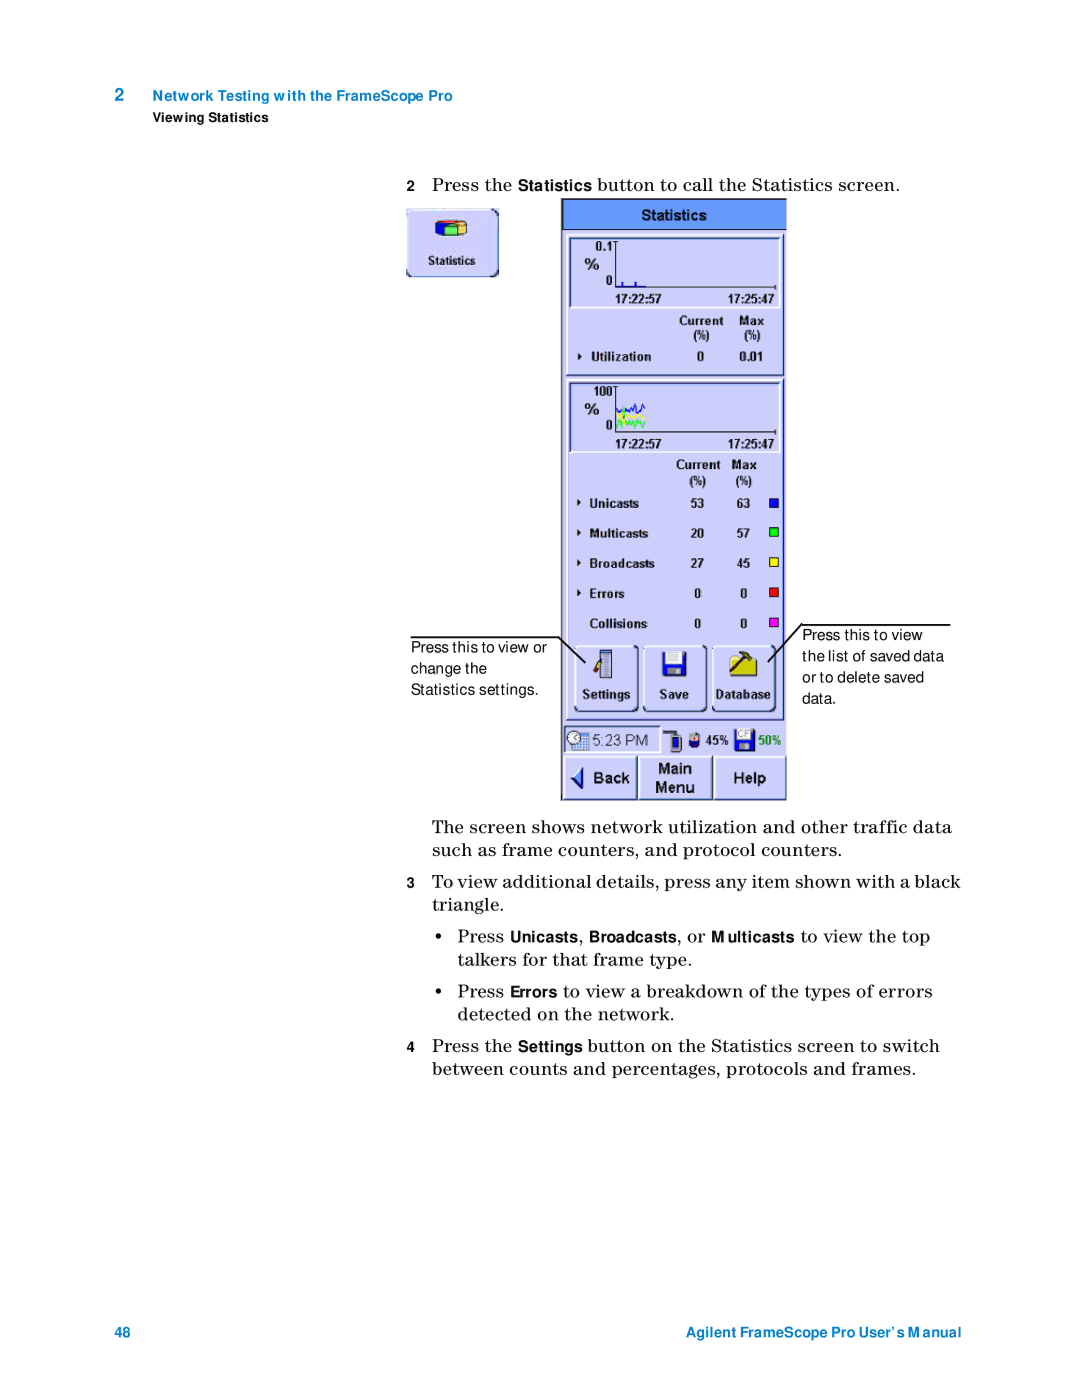
2Press the Statistics button to call the Statistics screen.
| Press this to view | |
Press this to view or | ||
the list of saved data | ||
change the | ||
or to delete saved | ||
Statistics settings. | ||
data. | ||
|
The screen shows network utilization and other traffic data such as frame counters, and protocol counters.
3To view additional details, press any item shown with a black triangle.
•Press Unicasts, Broadcasts, or Multicasts to view the top talkers for that frame type.
•Press Errors to view a breakdown of the types of errors detected on the network.
4Press the Settings button on the Statistics screen to switch between counts and percentages, protocols and frames.
48 | Agilent FrameScope Pro User’s Manual |
