HP StorageWorks 8q Fibre Channel Switch Management
Copyright 2004 Hewlett-Packard Development Company, L.P
Contents
Contents
Contents
Contents
Contents
Contents
Show Setup command
Figures
Tables
Contents
About This Guide
Related documentation
Intended audience
This section covers the following topics
This document follows the conventions in Table
Text symbols
Document conventions
Conventions consist of the following
Equipment symbols
Getting help
HP installation and configuration assistance
HP authorized reseller
Web site, select the appropriate product or solution
HP technical support
HP storage web site
Switch Manager
Installing Switch Manager on Windows systems
Installing Switch Manager
Minimum Requirements
Installing Switch Manager on Linux systems
Starting Switch Manager
To exit a Switch Manager application session
Exiting Switch Manager
Select File Exit
Select File Save Default Fabric View File
Removing Switch Manager
Removing Switch Manager from Windows
Removing Switch Manager from Linux
Preferences dialog box
Setting Switch Manager preferences
Select Help Help Topics
Using online help
Using the Switch Manager user interface
Viewing software version and copyright information
Menu bars
Switch Manager Faceplate window
Shortcut Selection
Faceplate display menu bar options and shortcut keys
Fabric tree
Tool bar
Button Description
Graphic window
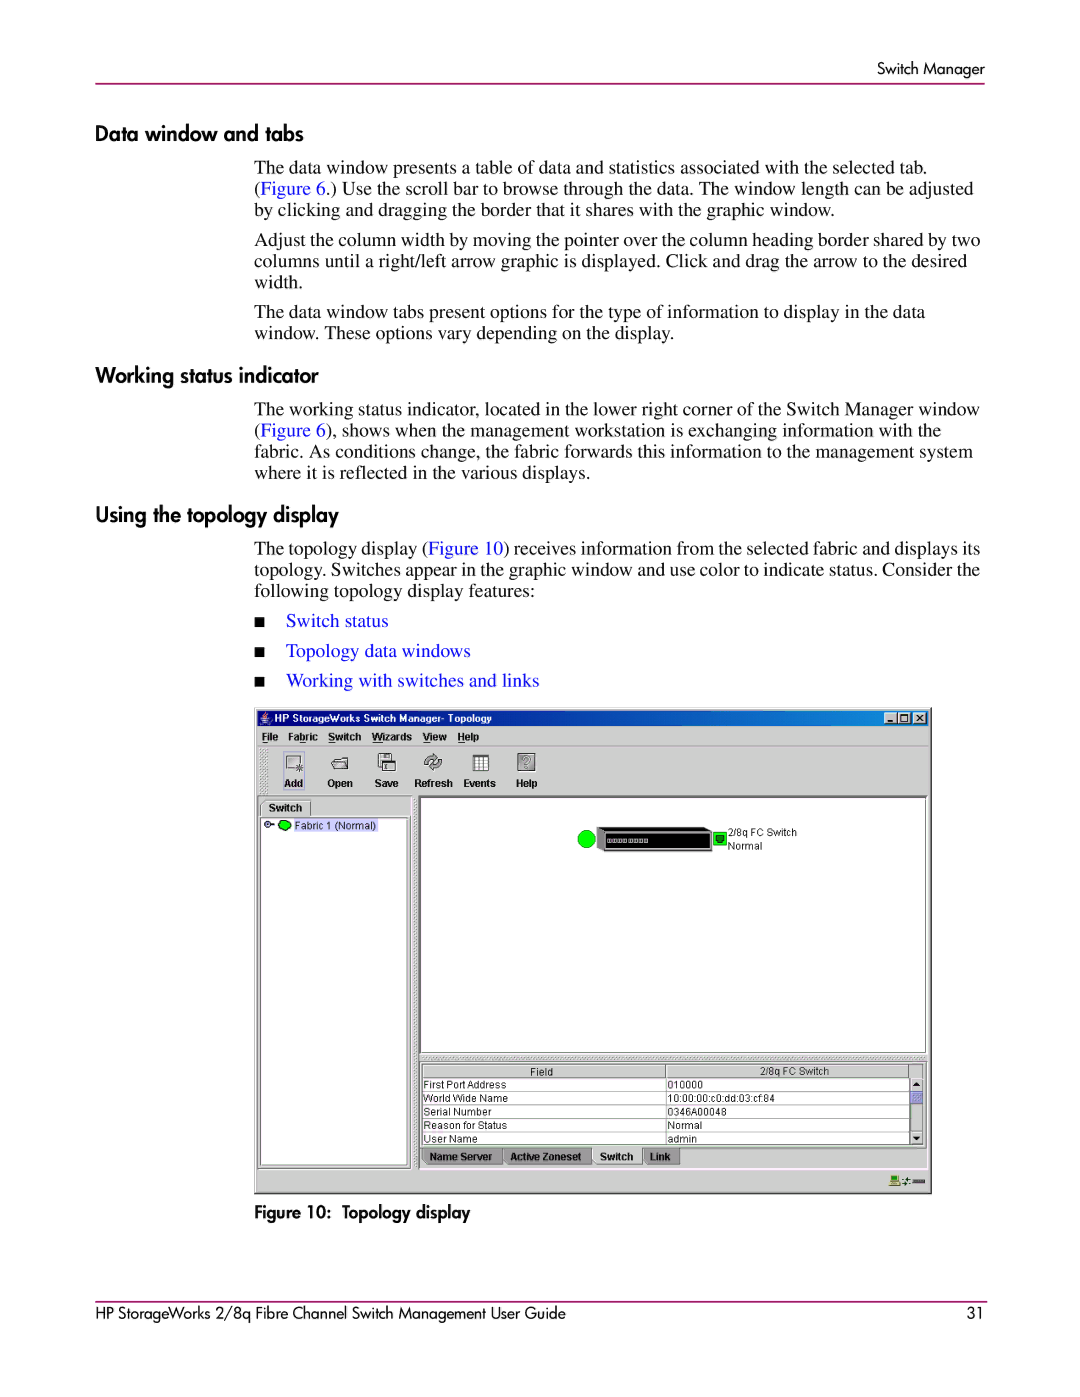
Using the topology display
Working status indicator
Data window and tabs
Selecting switches
Faceplate display Port views and status
Using the faceplate display
Selecting ports
User account security
Managing fabric security
Components of Fibre Channel fabric security are
Managing the fabric database
Fabric services
Select Snmp Enabled in the Snmp Configuration area
Select In-band Management Enable
Select Fabric Remove Fabric
Removing a fabric
Opening a fabric view file
Click Add Fabric
Saving a fabric view file
Adding a new switch to a fabric
Rediscovering a fabric
Deleting switches and links
Replacing a failed switch
Select Switch Reset Switch
Fabric status
Displaying fabric information
Select View Refresh
Event Browser
Severity Icon Description
Filter Events dialog box Sorting the Event Browser
Select File Save As
Active Zoneset data window
Zoning concepts
Zoning a fabric
Soft Zones
Zoning configuration
Restoring default zoning
Using the Zoning Config dialog box
Merging fabrics and zoning
Using the Edit Zoning dialog box
Edit Zoning dialog box
Tool bar button / icon Description
Managing zone sets
Copying a zone to a zone set
Managing zones involves the following
Managing zones
Select Edit Remove
Click WWN, Domain Port, or FC Address
Select Edit Remove Zone from All Sets
Managing aliases
Select Edit Add Members
Saving the Zoning Database to a File
Click Insert Click OK
Managing user accounts
Account name Password Admin authority Expiration
Click Add Account
Creating user accounts
Removing a user account
Select an option from the Account Expiration Date area
Click Change Password
Changing a user account password
Modifying a user account
User Account Administration dialog box Change Password
Click Modify Account
Displaying switch information
Click Close
Name Server data window
Switch data window
Entry Description
Port Statistics data window
Link data window
Port Information data window
Configured Zonesets data windows
Port Threshold Alarm Configuration dialog box
Configuring port threshold alarms
Exporting name server information to a file
Paging a switch
Switch configuration is divided into areas
Setting the date/time and NTP client
Resetting a switch
Configuring a switch
Switch properties
Configuration wizard
Parameter Description
In-band Management parameter
Network properties
Network Properties dialog box IP Configuration parameters
Previously configured IP address
Snmp trap configuration parameters
Restoring a switch configuration
Archiving a switch configuration
Restore dialog boxes Full and Selective
Setting Value
Restoring the factory default configuration
Downloading a support file
Installing firmware
Hardware status LEDs
Displaying hardware status
Port status
Displaying port information
State Description
Port/transceiver states
LIP ALPD,ALPS
Port Information data window entries
Port Properties dialog box
Configuring ports
Port Speed parameters
Port States parameters
Stream Guard parameters
Changing the port symbolic name
Port Type parameters
Interoperability Credits parameters
Designating donor ports
Extending port credits
Testing ports
Resetting a port
Select Port Reset Port
Port Loopback Test dialog box
Click Start Test
This section describes the following
Starting HP StorageWorks Fabric View
Exiting HP StorageWorks Fabric View
Setting HP StorageWorks Fabric View preferences
Changing the Default Fabric View File encryption key
Setting the polling frequency
Customizing graphs
Displaying graphs
Removing graphs
Arranging graphs in the display
Default Graph Options dialog box
Select a graph
Printing graphs
Rescaling a selected graph
Saving graph statistics to a file
Add a Fabric messages
Fabrics File-Open, Save messages
Message User action
Network Properties dialog box messages
Switch Properties dialog box messages
Domain IDs must be in the same range
Port Properties dialog box messages
Faceplate display messages
Deselect the donor ports, and then retry
Port Loopback Test dialog box messages
Load Firmware dialog box messages
No device detected in selected port yet. Test
Zoning dialog box messages
Extended Credits wizard messages
Zoning configuration to the fabric. This feature
Save Fabric View dialog box messages
Restore Configuration dialog box messages
Trap Configuration dialog box messages
Switch Manager 110
Commands,
Command Line Interface
Account name Password Authority Admin
Parameter Setting
Modifying a configuration
Working with switch configurations
Backing up a switch configuration
Ftp ipaddress userimages password images ftp bin
Keystroke Effect
Monitoring commands Administrative commands
Admin
Admin command
Opens the admin session
Admin session for all keywords except List and Members
Alias command
Admin session for all keywords except Backup and List
Config command
Edit configname
#ftp symbolicname or ipaddress user images
Create Support command
Firmware Install command
Date command
Admin session, except to display the date
Hardreset command
None
Help command
Hotreset command
History command
Manages and installs switch firmware
Image command
Displays the list of image files that reside on the switch
Wait for the unpack to complete
Reinitializes the specified loop port
Lip command
Passwd command
Changes a user account’s password
Following is an example of a successful Ping command
Ping command
Ps command
IP address of the switch to query
You can also press Ctrl+D to close the Telnet session
Quit command
Reset command
Closes the Telnet session
Config Configname
Arbff
Parameter Default setting
Port threshold alarm configuration default settings
Sets a variety of switch parameters
Set command
Admin for all keywords except Alarm, Beacon, and Pagebreak
Config option
Admin and Config Edit
Set Config command
Set Config port parameters
Enabled only for ports connected to initiator devices.
Set config threshold parameters
See Set config threshold parameters on page 140.
8q FC Switch
Following is an example of the SET Config Switch command
Following is an example of the SET Config Threshold command
Following is an example of the SET Config Zoning command
Set Log Command
Clears all log entries
Display filter
Admin, except for the Clear keyword
Set Port command
Specifies the port. Ports are numbered beginning with
Set Setup command
Value on the switch and the Snmp management server must
Information if remote logging is enabled. The default is
Following is an example of the Set Setup System command
Show command
Displays fabric, switch, and port operational information
Displays Link State database information
Displays chassis component status and temperature
Displays list of current donor configuration for all ports
Displays the status of the active network interfaces
Lipalpdalps
Offline state. a loss of signal causes the switch to
Following is an example of the Show Chassis command
Displays switch operational information
Displays all connected devices
Following is an example of the Show NS domainID command
Following is an example of the Show Domains command
Following is an example of the Show Fabric command
Following is an example of the Show NS local domain command
Following is an example of the Show Interface command
Following is an example of the Show NS portID command
LIPF8F7
Following is an example of the Show Port command
Following is an example of the Show Topology command
Following is an example of the Show Switch command
Command Line Interface
Displays alarm threshold parameters for the switch
Show Config command
Following is an example of the Show Version command
Displays configuration parameters for the switch
Following is an example of the Show Config Switch command
Following is an example of the Show Config Zoning command
Following is an example of the Show Config Threshold command
Show Log command
Following is an example of the Show Log command
Following is an example of the Show Log Component command
Following is an example of the Show Log Level command
Following is an example of the Show Log Options command
Show Perf command
Displays the current Snmp and system settings
Show Setup command
Following is an example of the Show Perf command
Following is an example of the Show Perf Byte command
Following is an example of the Show Setup Mfg command
Displays manufacturing information about the switch
Displays the current Snmp settings
Displays the current system settings
Following is an example of the Show Setup System command
Test command
Shutdown command
To run the online loopback test, enter the following command
Admin, except for the List option
Uptime command
User command
Administers and displays user accounts
Following is an example of the User Add command
Following is an example of the User Accounts command
Following is an example of the User List command
Whoami command
Following is an example of the User Edit command
Following is an example of the User Delete command
Manages zones and zone membership on a switch
Zone Command
Following is an example of the Zone List command
Manages zone sets and component zones across the fabric
Zoneset command
Following is an example of the Zone Members command
Following is an example of the Zone Zonesets command
Following is an example of the Zoneset Active command
Opens a Zoning Edit session
Zoning command
Following is an example of the Zoneset List command
Following is an example of the Zoneset Zones command
Limit Description
E2JBOD2
Following is an example of the Zoning Limits command
Following is an example of the Zoning List command
Command Line Interface
Index
Index
Index
186
System configuration change 148 display
List definitions 179 Save edits Remove all Zoning command