5 – Managing Ports | 0 | |
|
| |
Graphing Port Performance |
|
|
|
|
|
|
|
|
5.6
Graphing Port Performance
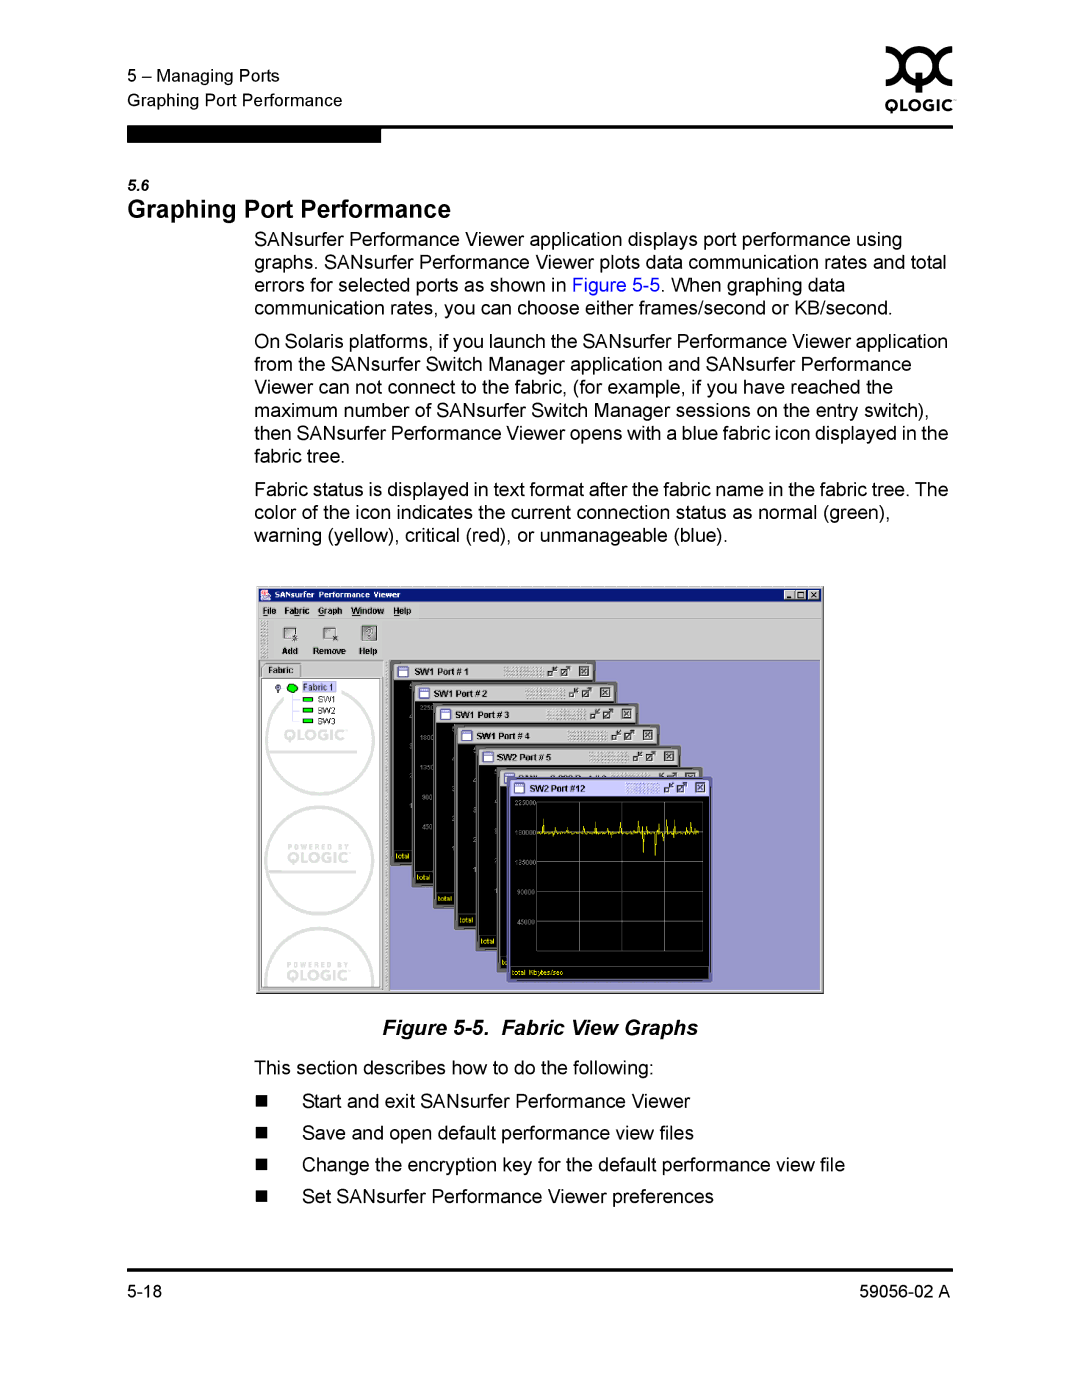
SANsurfer Performance Viewer application displays port performance using graphs. SANsurfer Performance Viewer plots data communication rates and total errors for selected ports as shown in Figure
On Solaris platforms, if you launch the SANsurfer Performance Viewer application from the SANsurfer Switch Manager application and SANsurfer Performance Viewer can not connect to the fabric, (for example, if you have reached the maximum number of SANsurfer Switch Manager sessions on the entry switch), then SANsurfer Performance Viewer opens with a blue fabric icon displayed in the fabric tree.
Fabric status is displayed in text format after the fabric name in the fabric tree. The color of the icon indicates the current connection status as normal (green), warning (yellow), critical (red), or unmanageable (blue).
Figure 5-5. Fabric View Graphs
This section describes how to do the following:
Start and exit SANsurfer Performance Viewer
Save and open default performance view files
Change the encryption key for the default performance view file
Set SANsurfer Performance Viewer preferences