| segment |
|
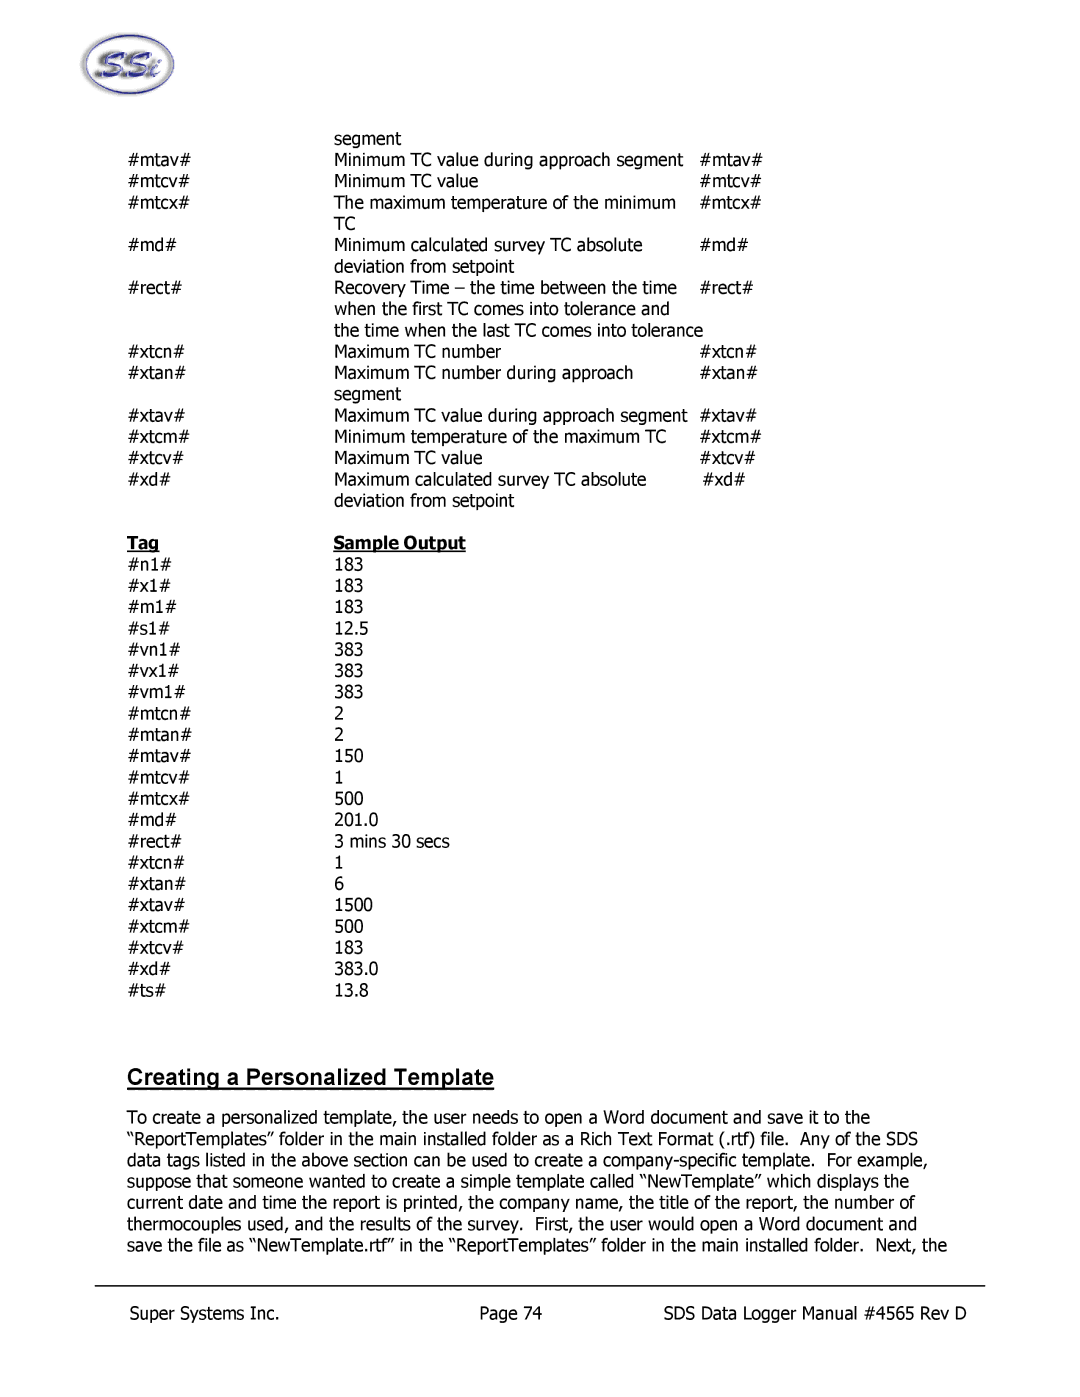
#mtav# | Minimum TC value during approach segment | #mtav# |
#mtcv# | Minimum TC value | #mtcv# |
#mtcx# | The maximum temperature of the minimum | #mtcx# |
| TC |
|
#md# | Minimum calculated survey TC absolute | #md# |
| deviation from setpoint |
|
#rect# | Recovery Time – the time between the time | #rect# |
| when the first TC comes into tolerance and |
|
| the time when the last TC comes into tolerance | |
#xtcn# | Maximum TC number | #xtcn# |
#xtan# | Maximum TC number during approach | #xtan# |
| segment |
|
#xtav# | Maximum TC value during approach segment | #xtav# |
#xtcm# | Minimum temperature of the maximum TC | #xtcm# |
#xtcv# | Maximum TC value | #xtcv# |
#xd# | Maximum calculated survey TC absolute | #xd# |
| deviation from setpoint |
|
Tag | Sample Output |
|
#n1# | 183 |
|
#x1# | 183 |
|
#m1# | 183 |
|
#s1# | 12.5 |
|
#vn1# | 383 |
|
#vx1# | 383 |
|
#vm1# | 383 |
|
#mtcn# | 2 |
|
#mtan# | 2 |
|
#mtav# | 150 |
|
#mtcv# | 1 |
|
#mtcx# | 500 |
|
#md# | 201.0 |
|
#rect# | 3 mins 30 secs |
|
#xtcn# | 1 |
|
#xtan# | 6 |
|
#xtav# | 1500 |
|
#xtcm# | 500 |
|
#xtcv# | 183 |
|
#xd# | 383.0 |
|
#ts# | 13.8 |
|
Creating a Personalized Template
To create a personalized template, the user needs to open a Word document and save it to the “ReportTemplates” folder in the main installed folder as a Rich Text Format (.rtf) file. Any of the SDS data tags listed in the above section can be used to create a
Super Systems Inc. | Page 74 | SDS Data Logger Manual #4565 Rev D |
