Zhone Technologies 800, 900, 600 manual Typical Circuit Congestion Data Screen

Models: 800 600 900

1 240
Download 240 pages 20.47 Kb
Page 43
Image 43

FRS Card

ACS-FRS Card User Screens and Settings

2.3.5Circuit Congestion Data Screen

The ACS-FRS card also accumulates statistics that show you the congestion characteristics of each of the circuits. To access the Circuit Congestion Data Screen, press “g” (conG) in the FRS Circuit Performance Data Screen. Figure 2-7shows a typical Circuit Congestion Data Screen, and Table 2-6lists the actions you can perform from its bottom line.

The data on this screen is kept in 15-minute (900 seconds) time increments for a total of 96 periods (24 hours). Each screen shows the current 15 minute segment and the twelve past periods with totals at the bottom of the column. Press “d” (pgDn) to scroll backward through the previous 96 periods, or “u” (pgUp) to scroll forward through these periods. After each period, the oldest 15-minute segment (from exactly 24 hours ago) is discarded. Since information is not updated on screen in real time, you must press “r” (Refresh) periodically to obtain up-to-date statistics for the current period.

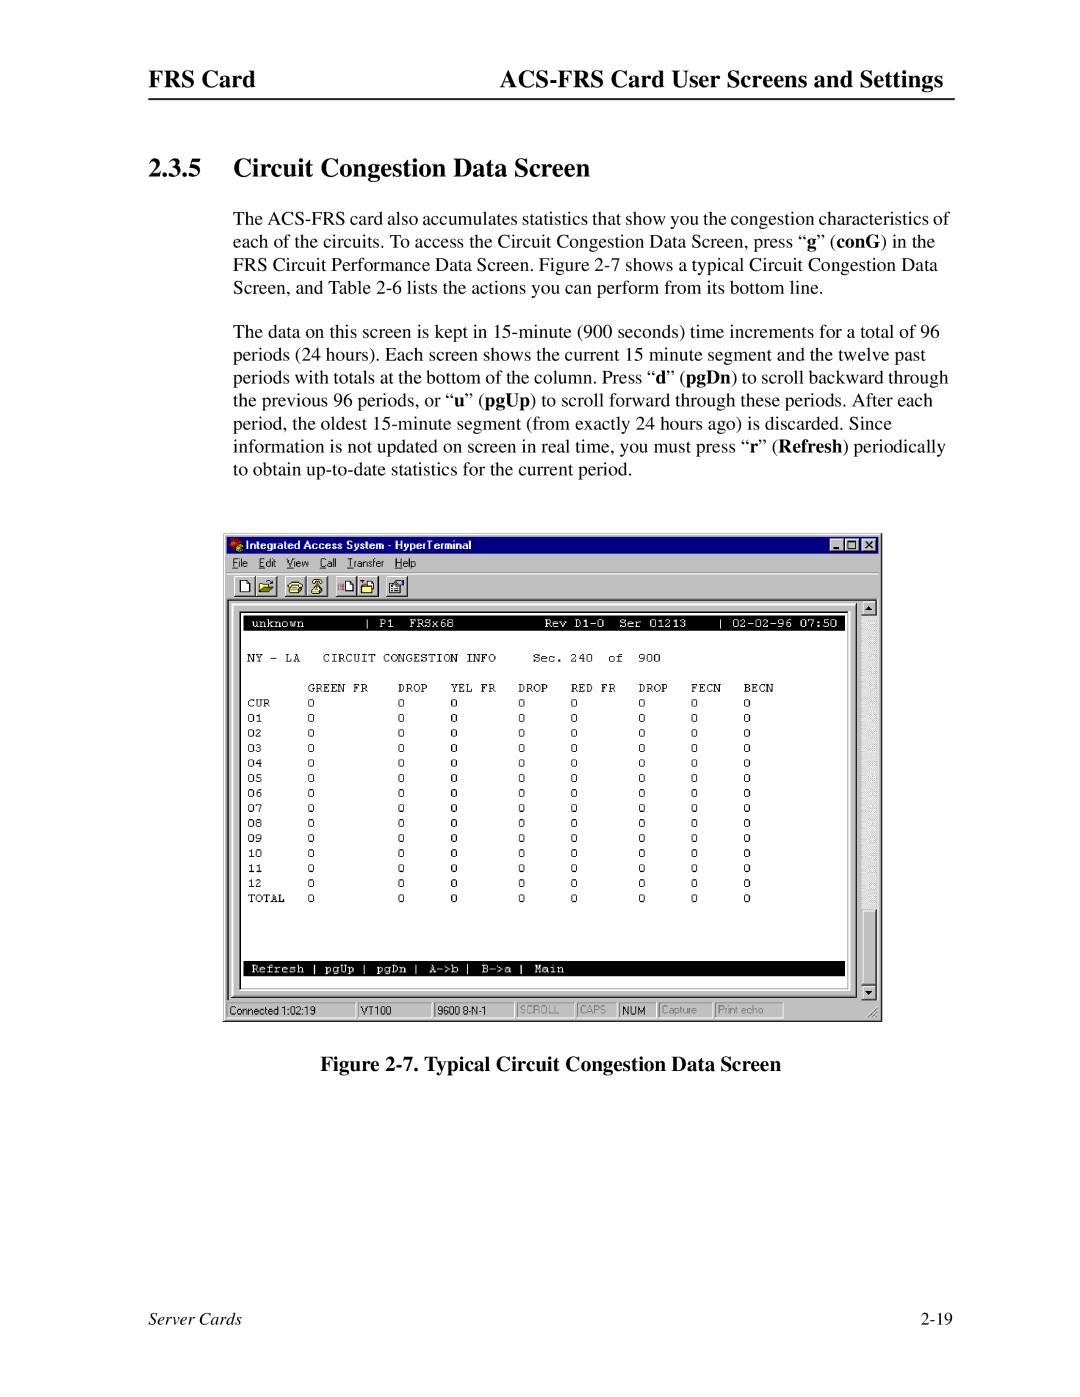
Figure 2-7. Typical Circuit Congestion Data Screen

Server Cards

2-19

Page 43
Image 43
Zhone Technologies 800, 900, 600 manual Typical Circuit Congestion Data Screen