Chapter 10. Statistics
Px Tx Bytes
In the Network Port view, this is the number of bytes transmitted on the network port that match the selected protocol type. In the DLCI view, this is the number of bytes transmitted on a particular DLCI that match the selected protocol type.
Px Tx Dist%
The distribution percentages show what portion of the data can be attributed to the protocols being tracked.
Top Talkers
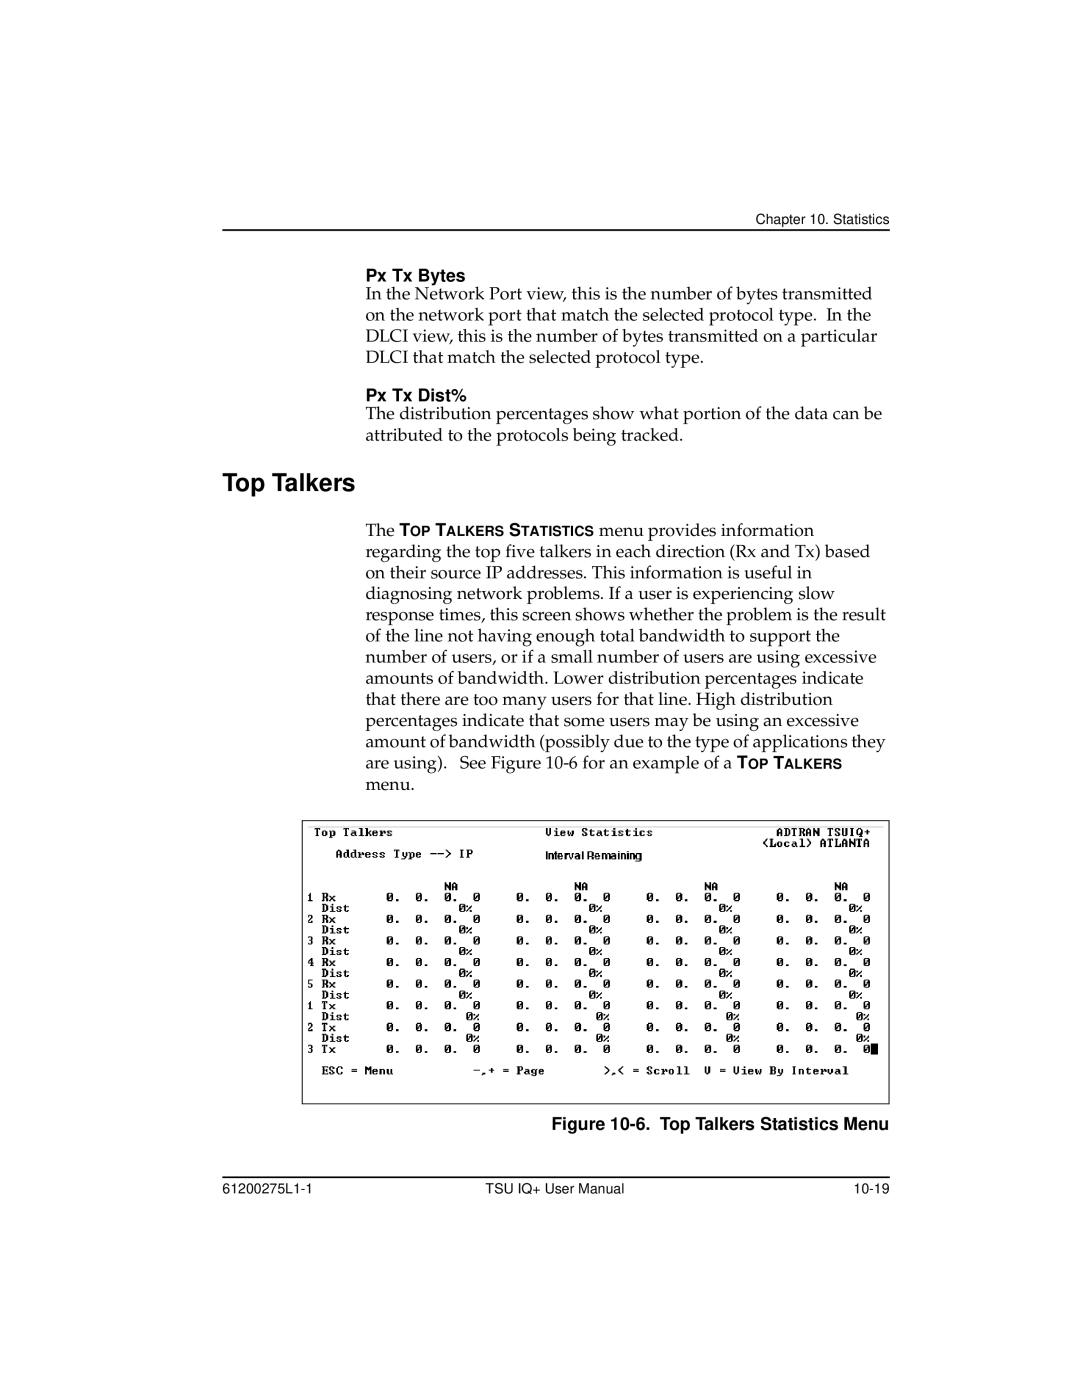
The TOP TALKERS STATISTICS menu provides information regarding the top five talkers in each direction (Rx and Tx) based on their source IP addresses. This information is useful in diagnosing network problems. If a user is experiencing slow response times, this screen shows whether the problem is the result of the line not having enough total bandwidth to support the number of users, or if a small number of users are using excessive amounts of bandwidth. Lower distribution percentages indicate that there are too many users for that line. High distribution percentages indicate that some users may be using an excessive amount of bandwidth (possibly due to the type of applications they are using). See Figure
Figure 10-6. Top Talkers Statistics Menu
TSU IQ+ User Manual |