Cabletron Ethernet Hubs Management Module Guide
9030367 E7
Virus Disclaimer
Restricted Rights Notice
Cabletron Ethernet Hubs
Management Module Guide
Contents
Chapter Application Views
Chapter Event and Alarm Messages
Cabletron Ethernet Hubs
9030367 E7 Vii
Chapter Performance Views
Viii Management Module Guide
Tables
Events and Alarms
What is in this Guide
Related Spectrum Documentation
Conventions
Other Related Documentation
Help
Getting Help
Page
Cabletron Ethernet Hubs Management Module
What is in this Chapter
Terminology
Terminology
Model Type Descriptions Model Type Name Hub Description
Media Interface Modules MIMs
Hub Chassis
Intelligent MIMs
Non-intelligent MIMs
Page
Device Views
Accessing the Device View
Ethernet Hubs Device View Description
Ethernet Hubs Device View Description
Select Logical or Physical
9030367 E7 Device Views
Cabletron Hub Device View
Device View Banner
Mmac Device Panel
Gauge Mode
Name
System UpTime
Gauge Mode Menu Options
Logical Gauge Menu Options
Option Definition
Mmac Device Statistics Panel
Mmac Device Statistics Panel
Log/Lin
Logical MIM Representation
Logical MIM Representation
Menu Option Gauge Color Definition
Port Number
Port Status Values Color Code
Port Performance
Thin
Mmac Device Panel
MiniMMAC Device Panel
Logical MIM Representation Gauge Control Panel
Gauge Control Panel
Reset
Keep Settings
Default
Apply
Physical MIM Representation
Physical MIM Representation
Logical Gauges Frames
Physical MIM Representation of MiniMMAC Device View
Cabletron Hub LEDs
Port Source Address View
Network Address
Slot/Port Number
IRM2 Hubs
Sirm Hubs
IRM3 Hubs
Irbm Hubs
MiniMMAC Hubs
Mrxi Hubs
RCV Receive
Mgmt Management
Changing MIM Representations
FLT Fault
Changing MIM Representations on the Entire Hub
Changing MIM Representations
Page
Application Views
Accessing the Application View
Application View Description
Application View Description
System
Device Name
Bridge Databases
9030367 E7 Application Views
Haspart Panel
Snmp System Group View
Snmp UDP Group View
Snmp Icmp Group View
Field Definition
Snmp Icmp Group View Information
Snmp IP Group View
IP Address Table Information View Fields
IP Add Table
IP Route Table
IP Route Table Information View Fields
Snmp IP Group View Information
More IP Stats
Irbm Mmac Bridge Database View
Database Entries
Dynamic Entry Age Lmt
Acquired Database Table
Select Filtering
Application View Description UPS Statistics View
UPS Statistics View
Permanent Database Table
Irbm Mmac Permanent Database Table
Battery Volts Out
Battery Capacity
AC Line Volts
UPS Model
Test
Scroll to Date-Time
Change Time Scale
Configuration Views
Accessing the Configuration View
Configuration View Description
Configuration View Description
Model Configuration
Device Configuration
Configuration View Buttons
Bridge Information
Source Address View
Device Source Address Table
Control View
Configuration View Description Device Source Address Table
Restart Device
Counters
Device Redundancy
Device Discover
Configure Alarms View
Broadcast Alarms
Error Threshold
Audible Alarm
Sound Audible Alarm
Redundancy View
Test Time of Day
Test Redundant Circuits
Redundancy Table
Mmac Redundancy Information View Fields
Circuit Reset View Fields Definition
Reset Circuit View
Address Delete View
Address Delete View Fields Definition
Last Server IP Address
Last Image Filename
Flash Size in Bytes
Flash Count
Additional Configuration View
Traps
Access
IP Addr
Community Table Detail View Field Definitions
Configuration View Description Bridge Configuration View
Bridge Configuration View
Bridge Name
Bridge Type
Firmware Version
Bridge Location
Number of Ports
Bridge/Root Information
Bridge Setup Information
Setup Information View Fields
Additional Bridge Information View Fields
Topology Information
Forward Delay & Hello Information View Fields
Topology Information View Table Fields
Fwd Dly & Hello Information
Hub Redundancy Management
Hub Redundancy Management
13. Irbm Bridge Control View Fields Definition
Hub Redundancy Management
Redundantly Connected Hub Device
Hub Redundancy Management Setting Redundant Circuits
Setting Redundant Circuits
XX.XX.XX.XX.XX.XX Xxxxxxxxxxxx XX-XX-XX-XX-XX-XX
Page
Accessing the Diagnostic View
Diagnostic Views
Diagnostic View Description
Diagnostic View Description
Sirm Hub
Total Transmit Collisions
Total Receive Collisions
Last Poll Transmit Collisions
Last Poll Receive Collisions
Events
Page
Device Performance View
Performance Views
Accessing the Device Performance View
Accessing the Device Performance View
IRBM, IRM2, IRM3 and MiniMMAC Hubs
Multi-Attribute Line Graph Definitions Statistic
9030367 E7 Performance Views
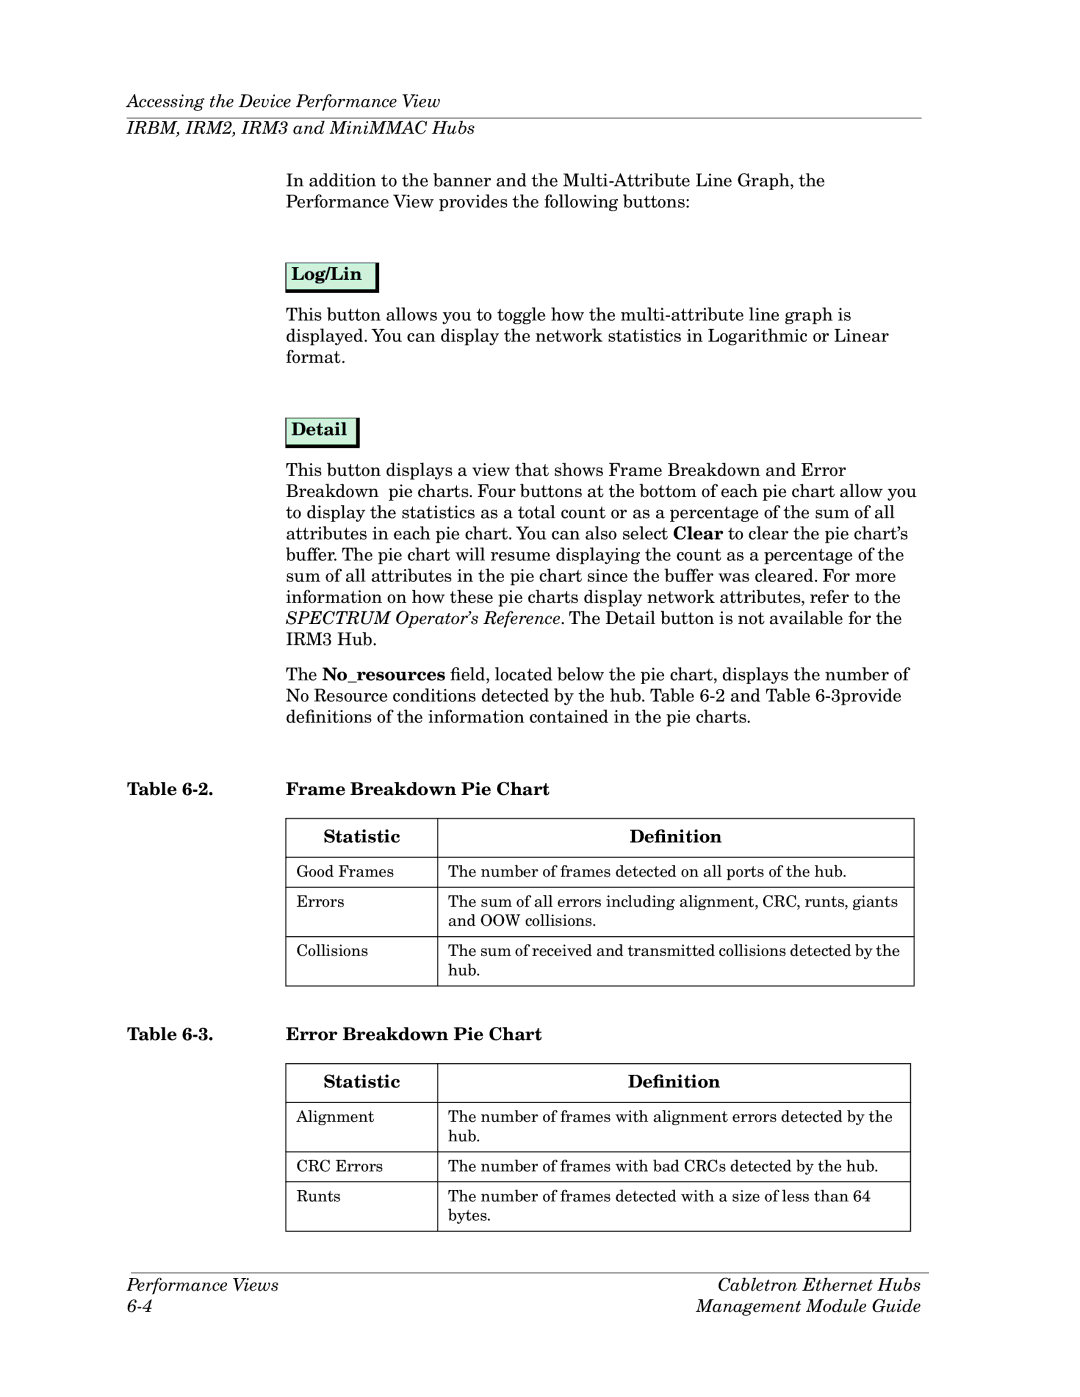
Error Breakdown Pie Chart
Frame Breakdown Pie Chart
Detail
Statistic Definition
Frames
Error Breakdown Pie Chart Statistic Definition
MIM Performance View
Sirm and Mrxi Hubs
MIM Performance View Sirm and Mrxi Hubs
Slot Number
MIM Performance View IRBM, IRM2, IRM3 and MiniMMAC Hubs
MIM Configuration
IRM2, IRM3, IRBM, and MiniMMAC Configure Alarms View Fields
MIM Configuration View Fields
Field Description
Sirm and Mrxi MIM Configure Alarms View Fields Description
Config Alarms
MIM Name
MIM Type
Device View Access Method
Port Performance View
Port Performance View
Port Performance View DevTop View Access Method
DevTop View Access Method
Port Performance View IRM2, IRM3, IRBM, and MiniMMAC Hubs
IRM2, IRM3, IRBM, and MiniMMAC Hubs
Port Configuration
Port Configuration View Field Definitions
Port Configure Alarms View Field Definitions
Port Performance View Sirm Hubs
Port Admin State
MIM/Port Number
Port Media Type
Mrxi Hub
Port Performance View Mrxi Hub
Ethernet Port Standard Statistics View Field Definitions
10. Ethernet Port Standard Statistics View Field Definitions
11. Ethernet Port Configure Alarms View Field Definitions
11. Ethernet Port Configure Alarms View Field Definitions
Page
Event and Alarm Messages
Cabletron Ethernet Hub Alarms and Events
Cabletron Ethernet Hub Alarms and Events
Events and Alarms Event Message Probable Cause Message
00010401
9030367 E7 Event and Alarm Messages
00010606
0001060c
00010613
0001061a
00010621
Index
Symbols
Index Cabletron Ethernet Hubs Management Module Guide
Name 4-12,4-25
9030367 E7 Index
Log 5-3,5-5,6-5,7-1
MIM
State 6-16,6-17Status
Tftp
Y, Z
Index Cabletron Ethernet Hubs Management Module Guide

