Controlling Geometry Window Appearance
8-4 Controlling Geometry Window Appearance
This section provides information about how to control the appearance of the Geometry application window by scrolling or zooming, and by showing or hiding axes and the grid.
Configuring View Window SettingsYou can use the following procedures to configure settings that control the appearance of the Geometry application window.
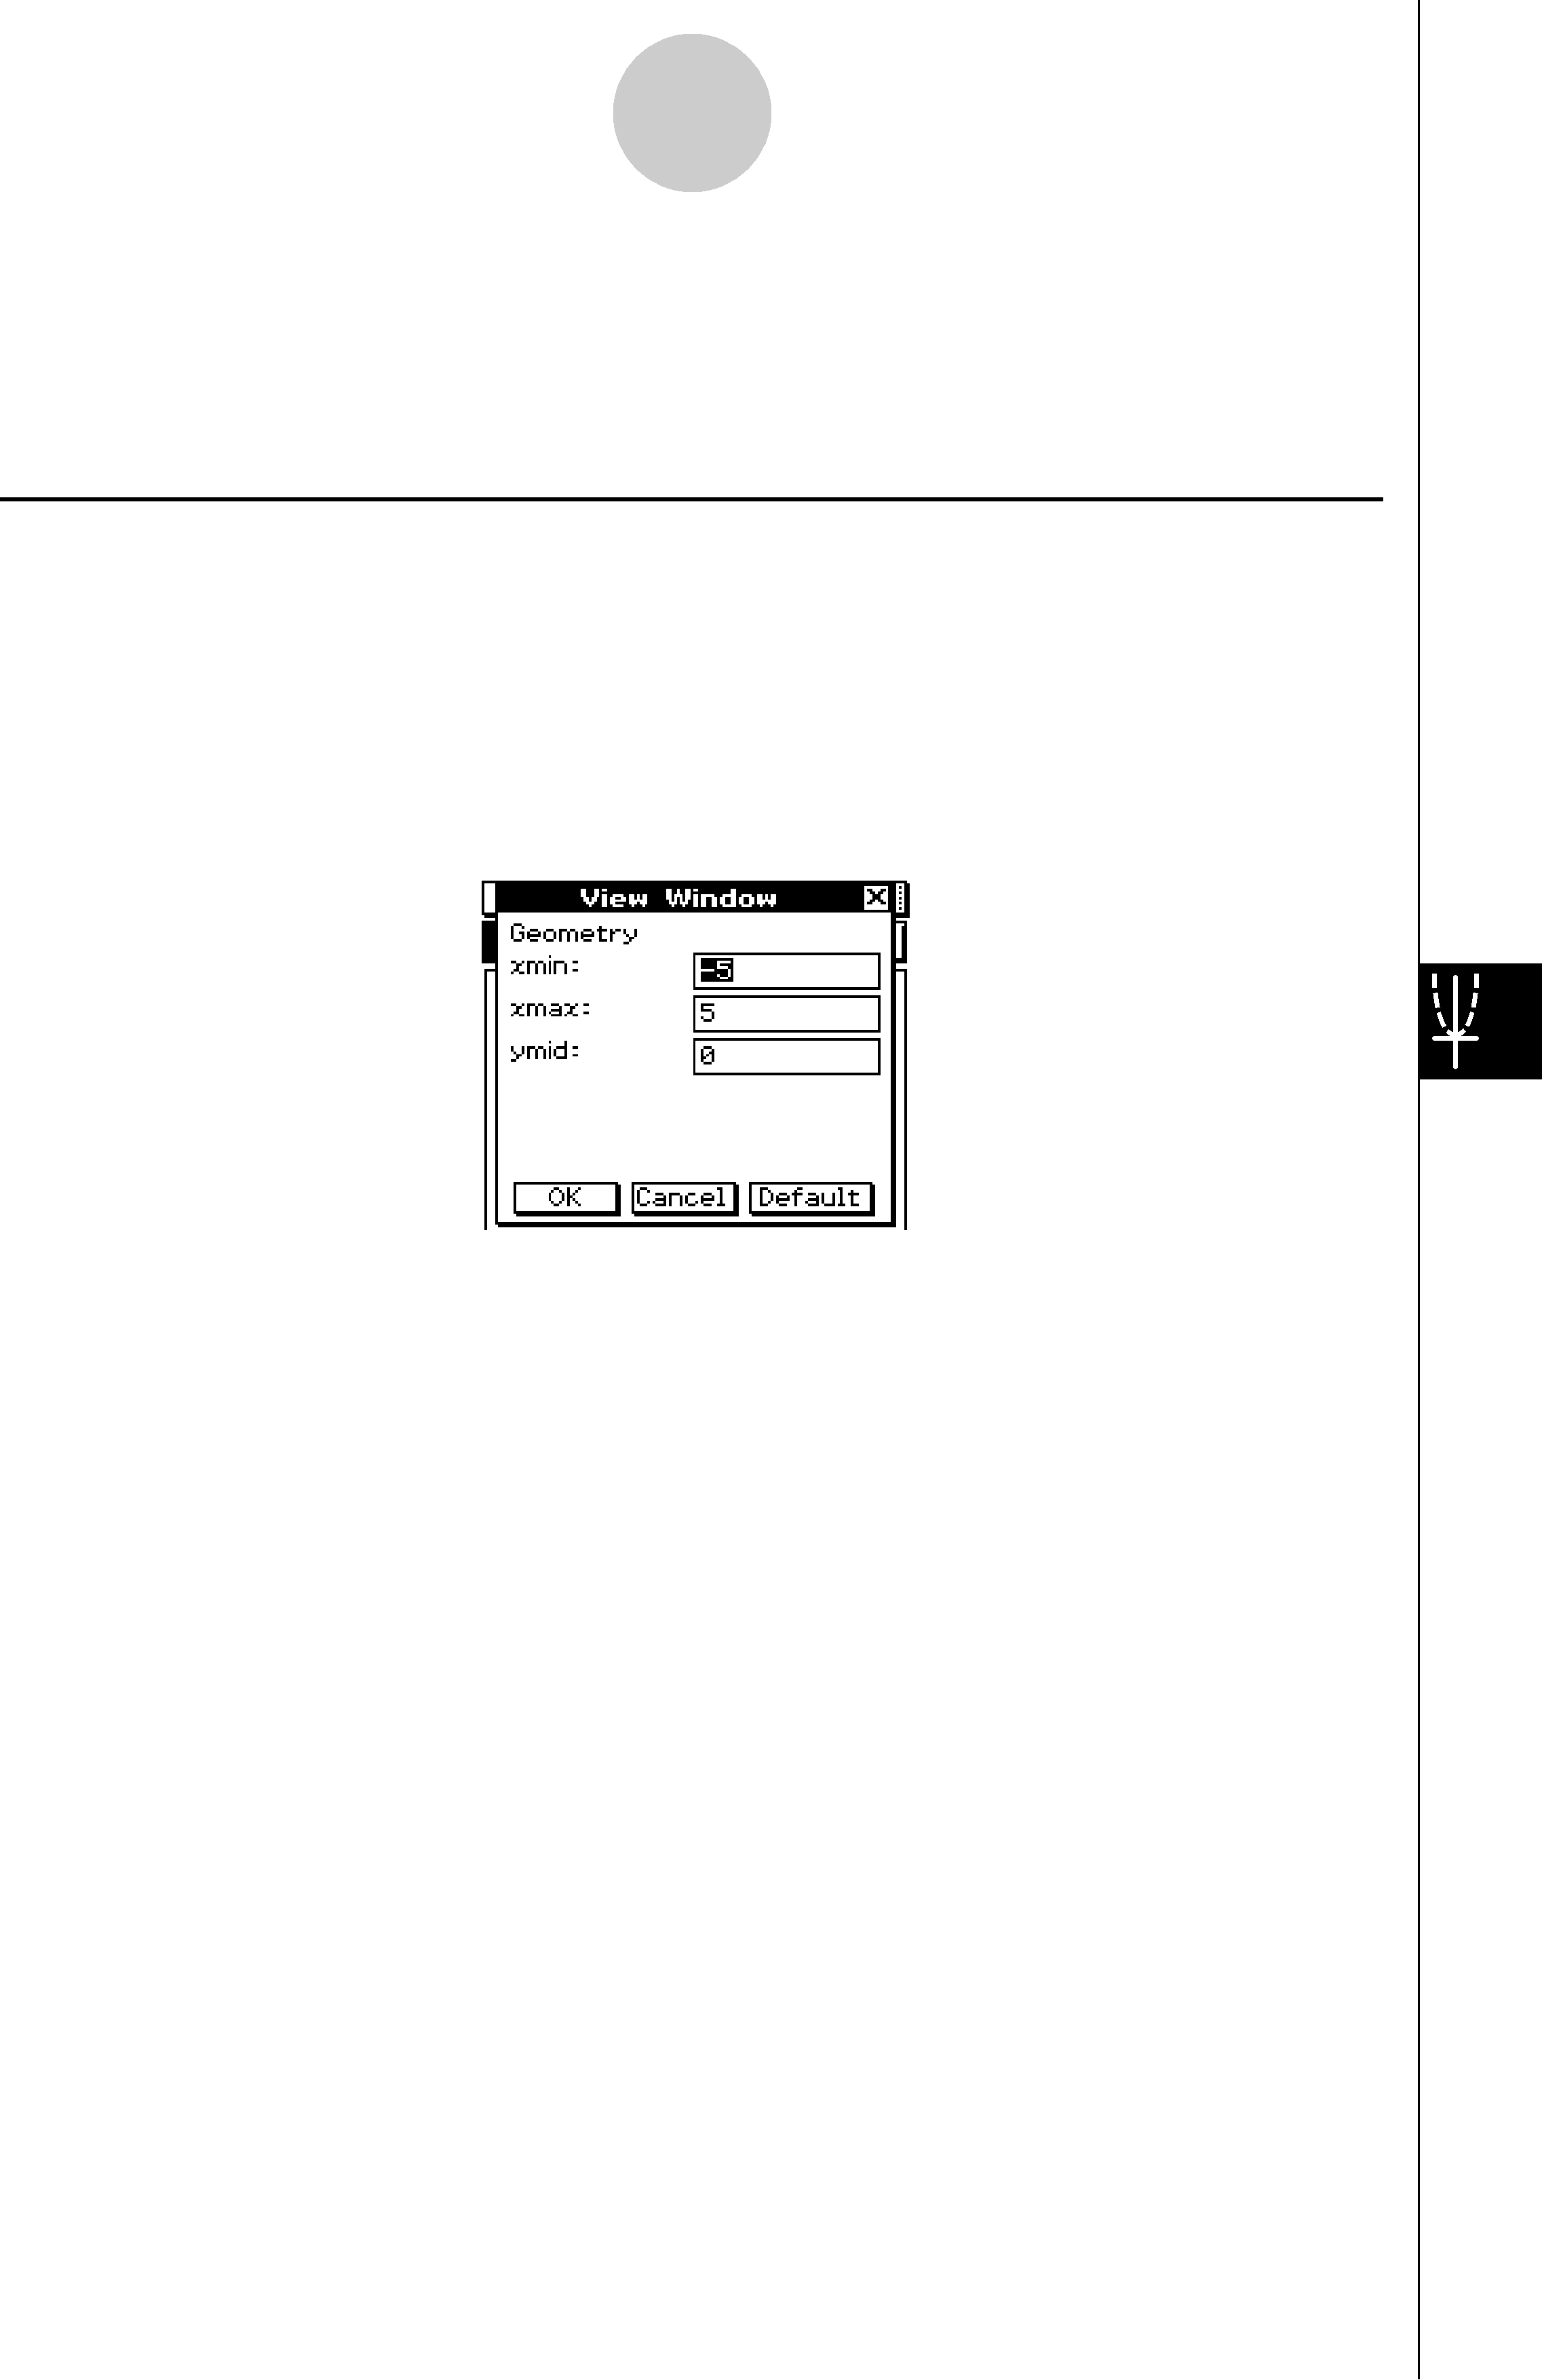
Tap , and then [View Window] to display the View Window dialog box. The View Window dialog box allows you to configure the
20060301