Graphing
STo change the appearance of the axesWhile a graph is on the Graph window, select [Toggle Axes] on the [View] menu or tap the Qtoolbar button to cycle through axes settings in the following sequence: axes on μ axes and values on μ axes and values off μ.
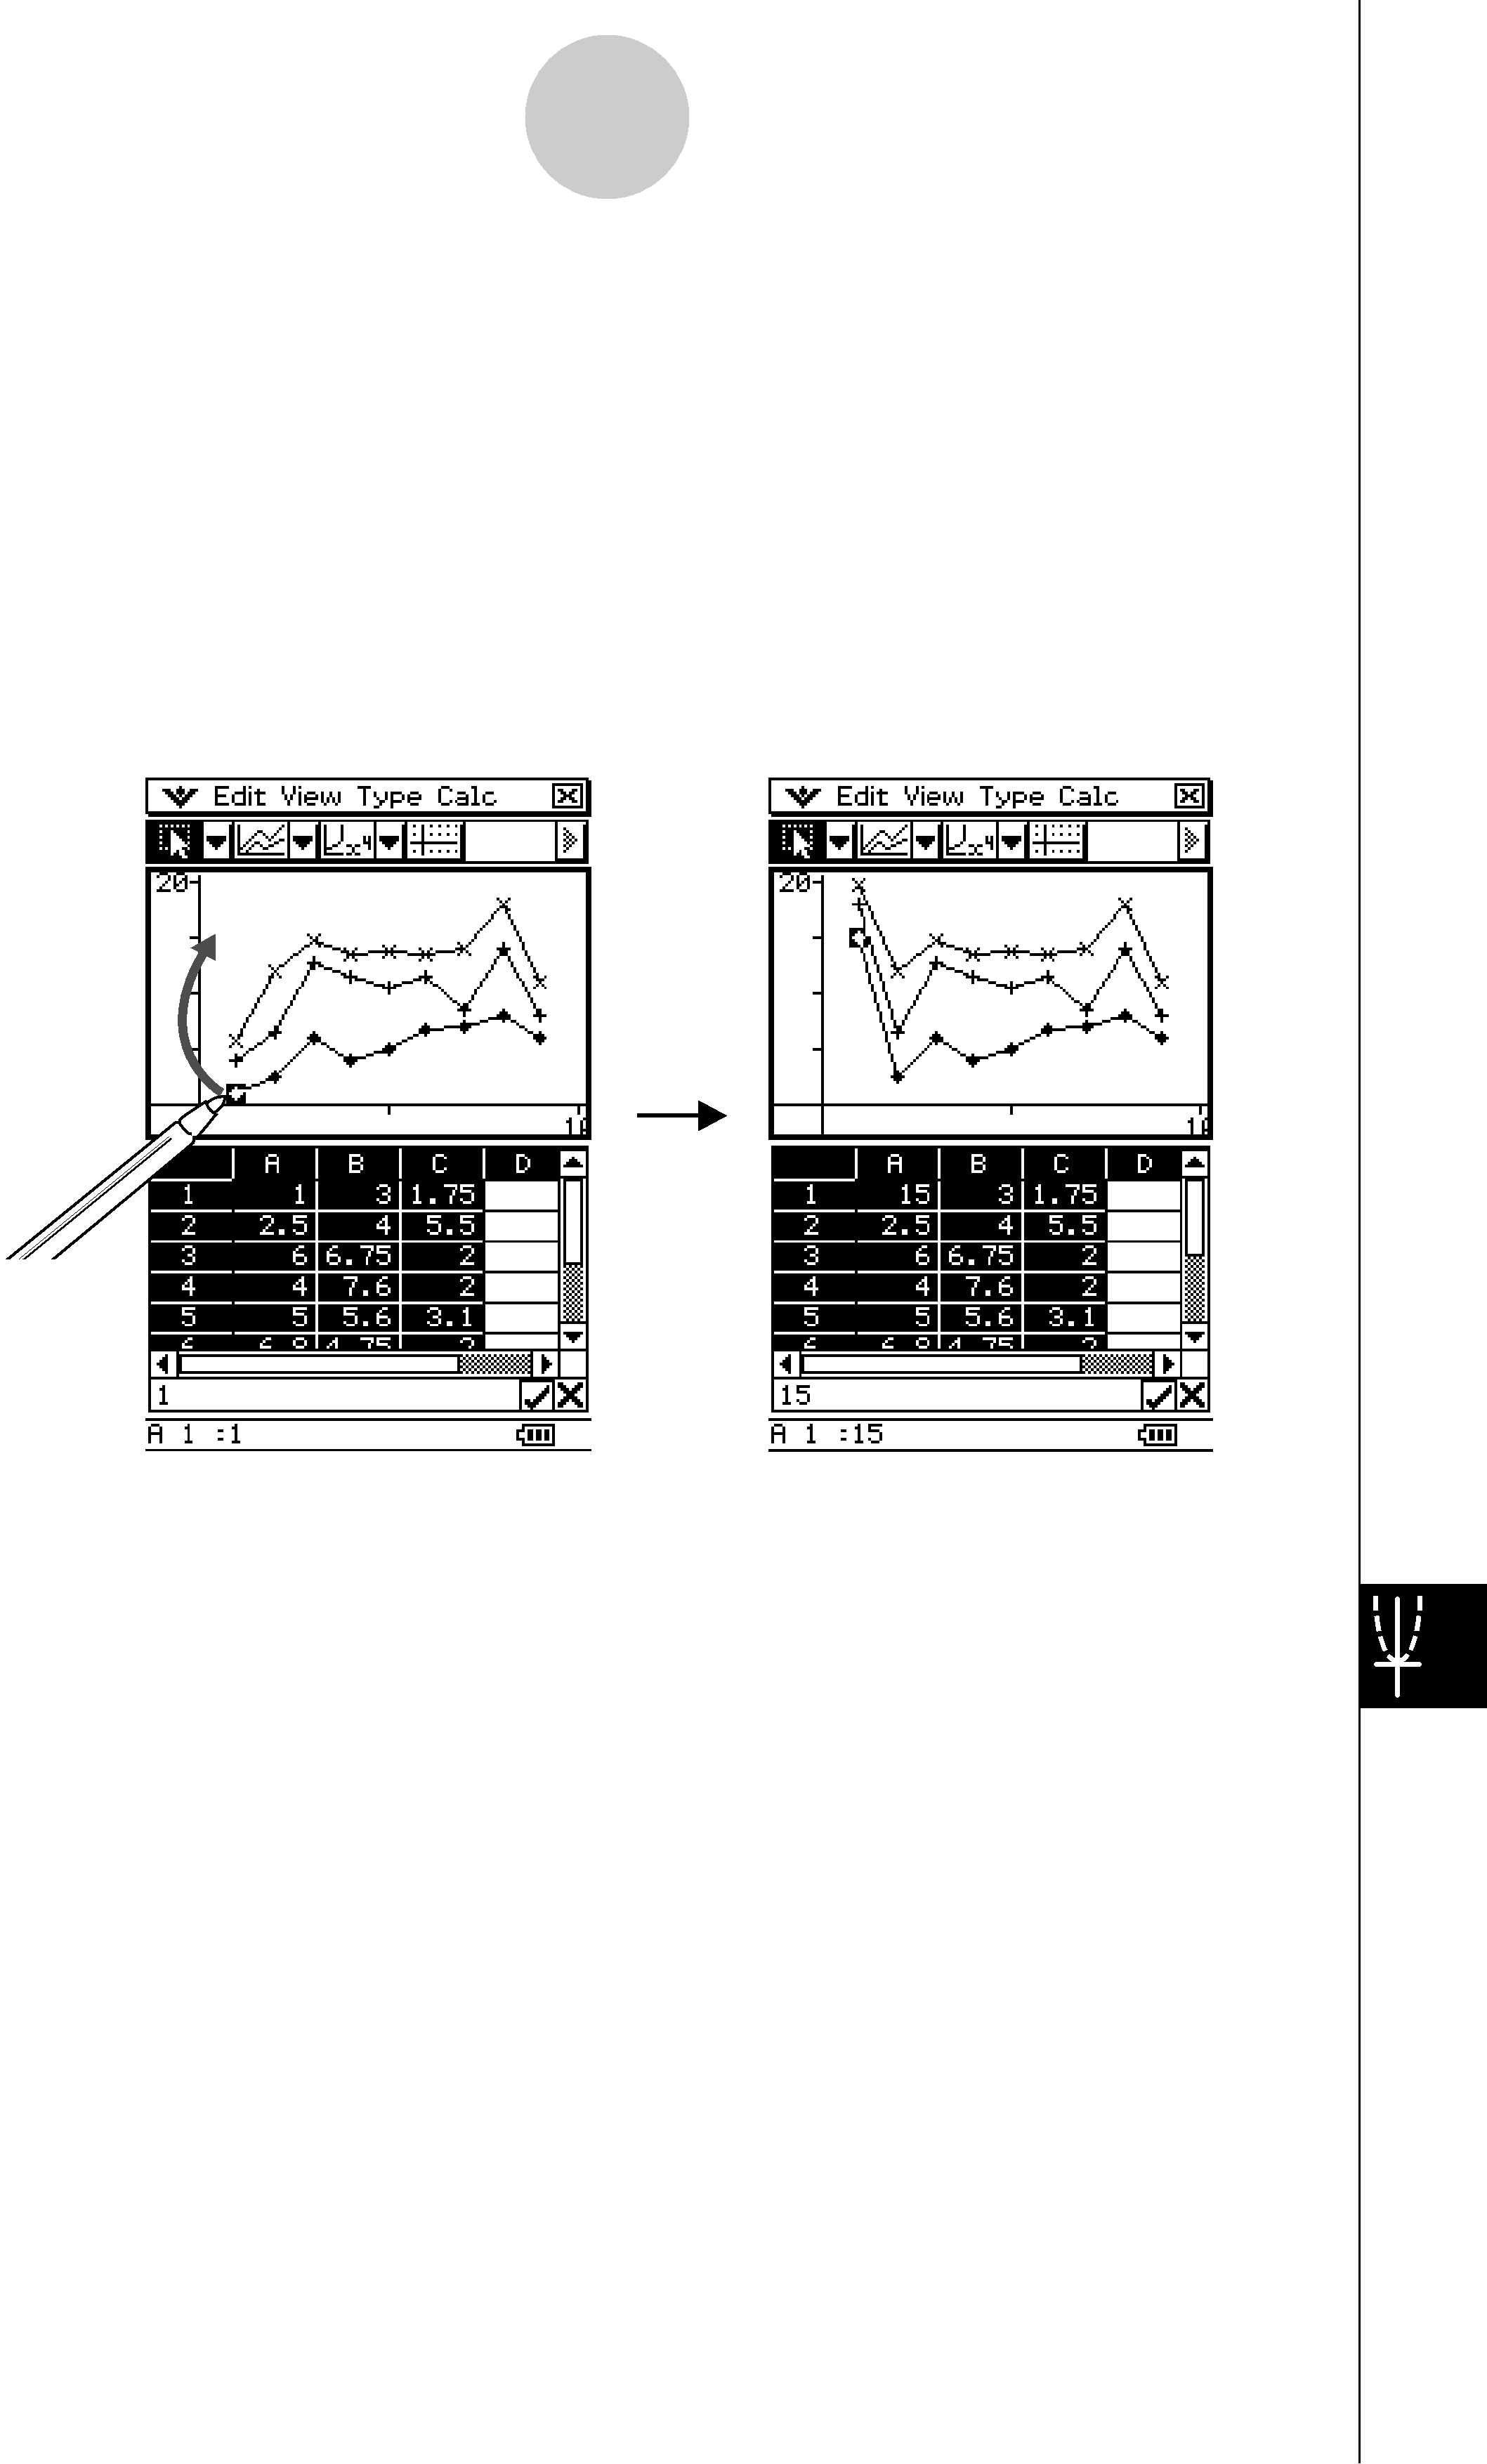
STo change the appearance of a graph by dragging a pointWhile a graph is on the Graph window, use the stylus to drag any one of its data points to change the configuration of the graph.
•You can change curves, make bars or columns longer or shorter, or change the size of pie graph sections.
•Changing a graph automatically changes the graph’s data on the Spreadsheet window.
Drag | Changes |
20090601