Graphing
Regression Graph OperationsAfter plotting a scatter graph of
(1)Enter the
(3)On the menu bar, tap [Calc] and then use the menu that appears to select the desired regression type (Linear Reg, MedMed Line, Quadratic Reg, Cubic Reg, Quartic Reg, Quintic Reg, Logarithmic Reg, Exponential Reg, abExponential Reg, Power Reg, Sinusoidal Reg, Logistic Reg).
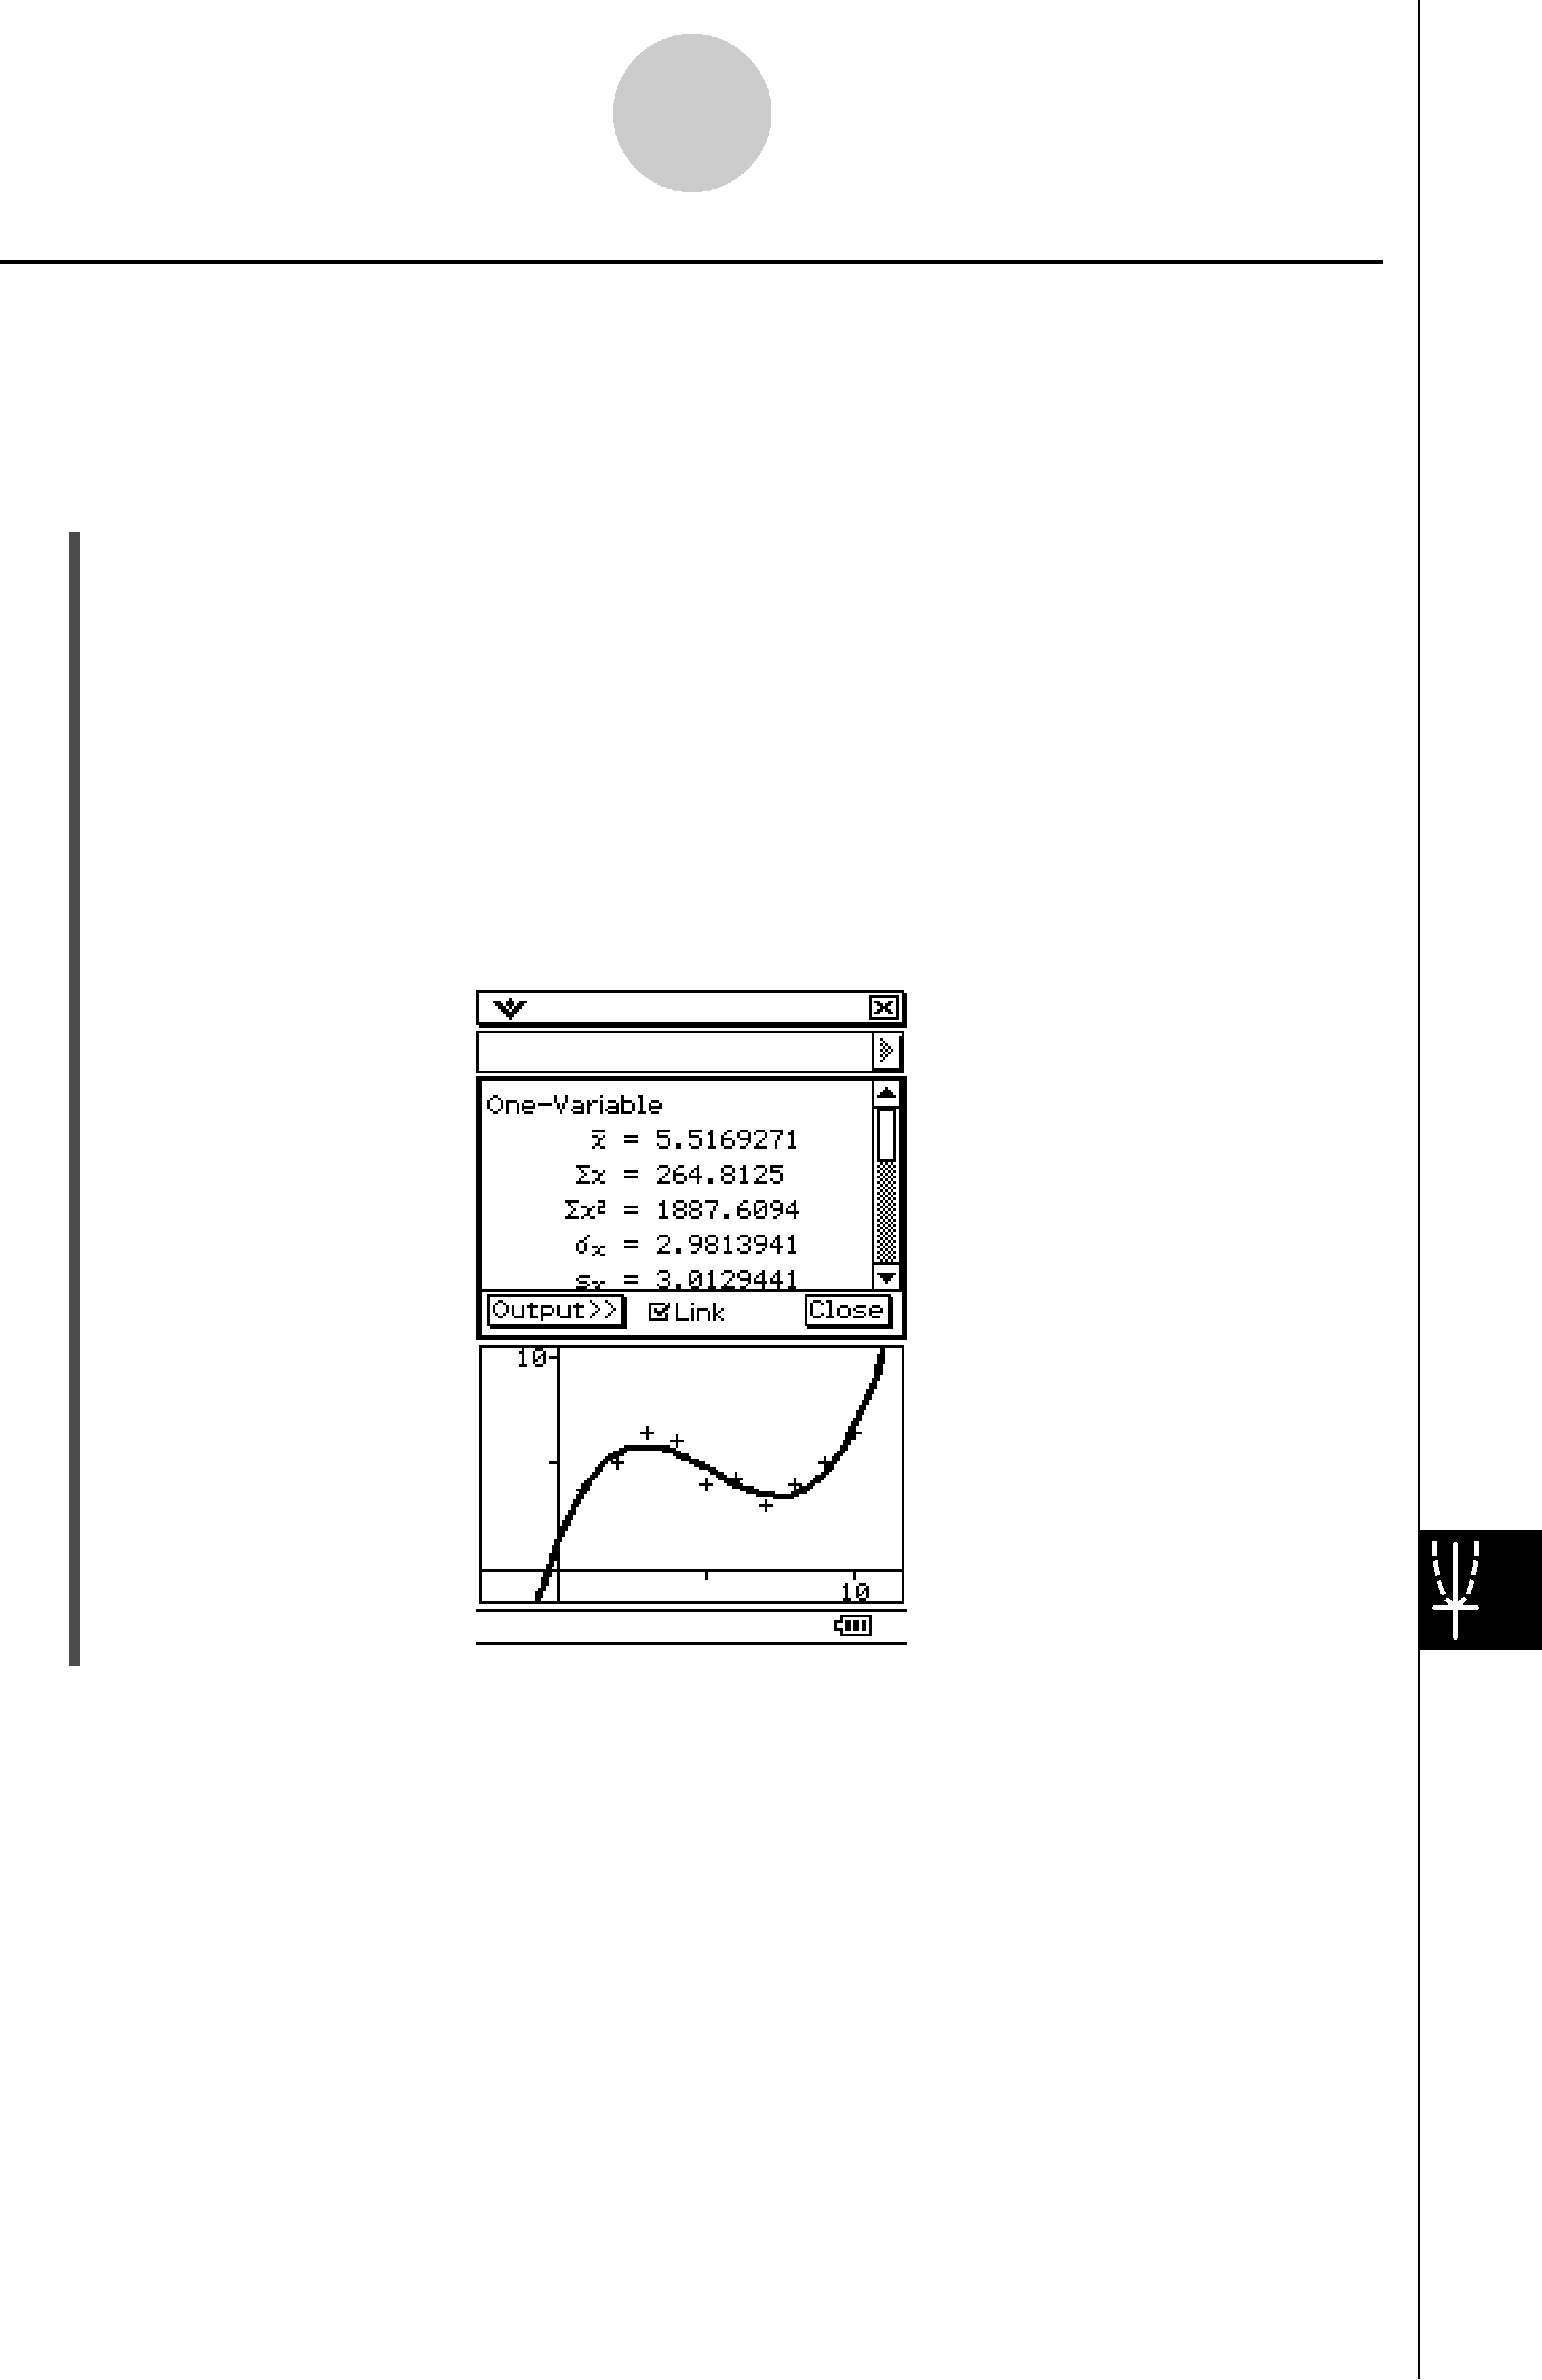
•This superimposes the regression graph on the scatter graph. Also, the regression calculation result window will appear in the half of the display.
Tip
•For details about how to use the Link check box and [Output>>] button on the regression calculation result window, see “Regression Calculations” (page
•Note that the regression calculation result window is not available for Quintic Reg.
20090601