Differential Equation Graph Window Operations
(1)Perform the operation under “Inputting an
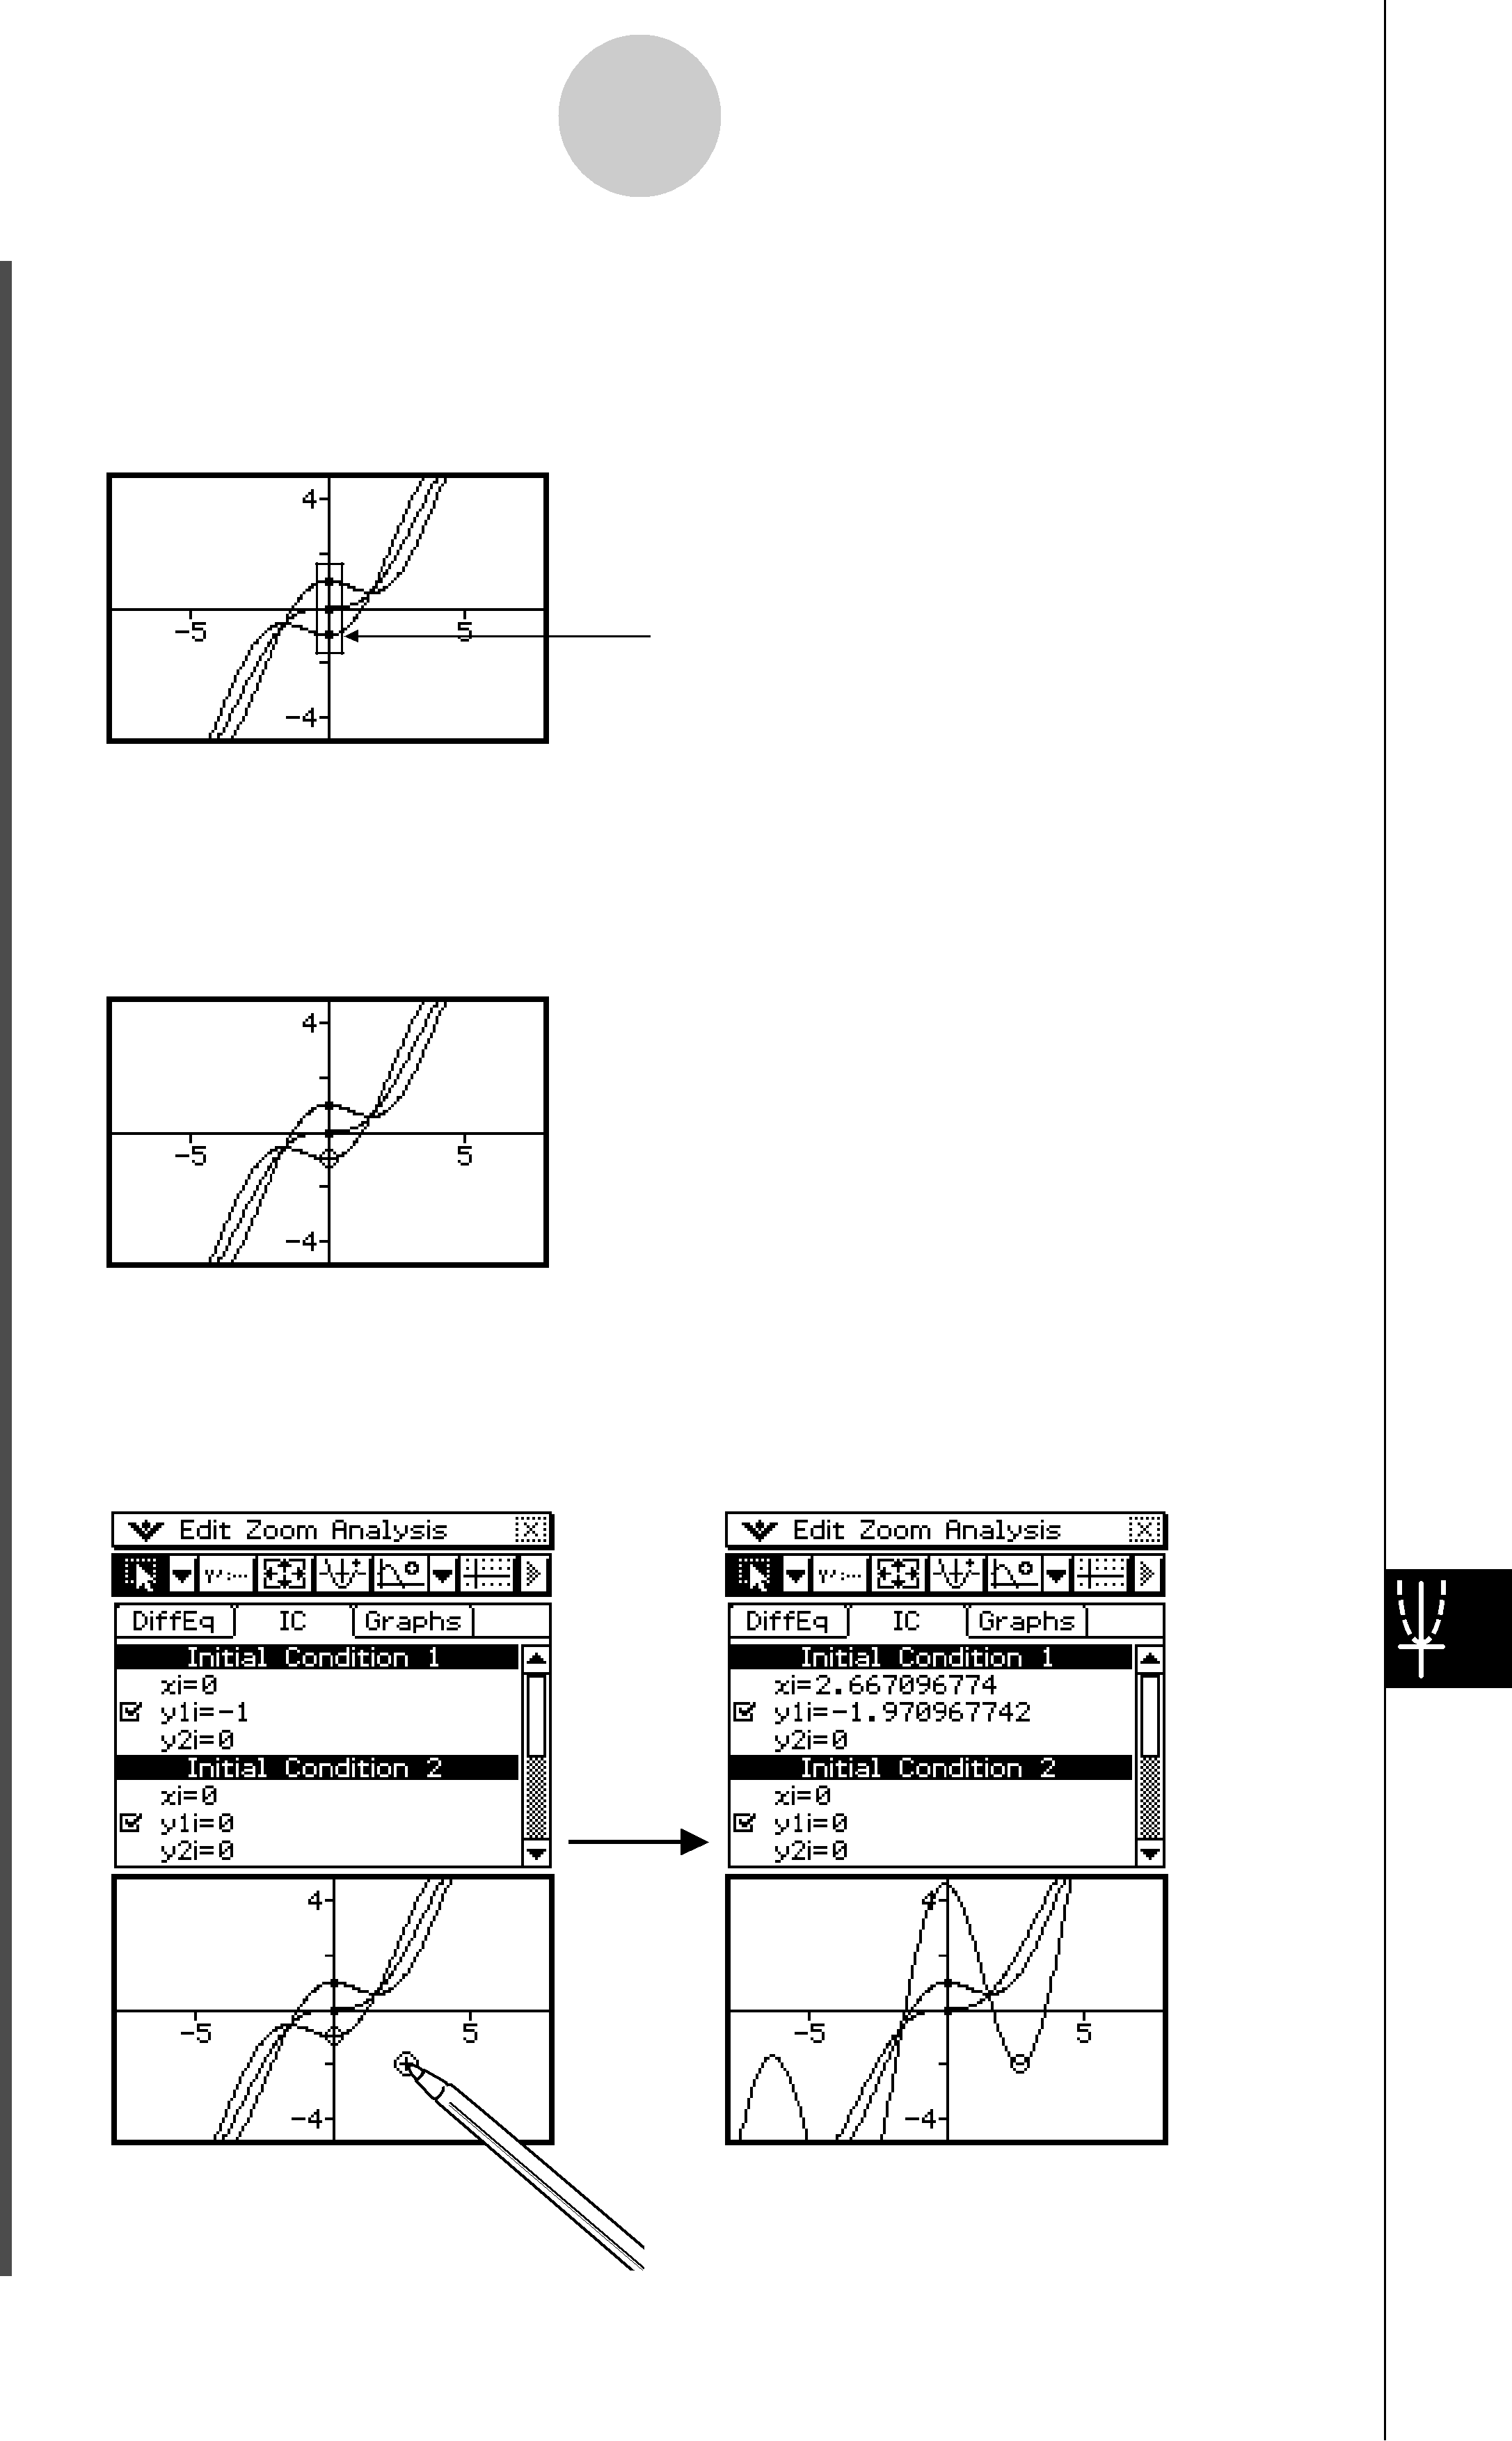
•Performing all of the steps will produce a graph like the one shown below to appear on the Differential Equation Graph window.
These dots are the currently configured initial conditions.
(2)Tap [Analysis] - [Select] or the toolbar 'button.(3)Tap one of the initial condition dots to select it.•Here we will tap the bottom dot, which is the Initial Condition 1 setting (xi, y1i, y2i) = (0, −1, 0).
The dot you tap becomes a white circle (5), which indicates that it is selected.
(4)Use the stylus to drag the dot to another location.•The applicable initial location will change to the coordinates of the location where you release the stylus after dragging the dot. After modifying an initial condition, the solution will be redrawn accordingly.
20060301