Qvwuxphqw
Fluke Industrial B.V
III
Reference Manual
Reference Manual also contains
Main Features
Page
Or model number
Following parts should be included in the shipment
VII
Contents
More Advanced Trigger Functions
HOW to USE More Advanced Functions
Screen Controls Auto Setup
Getting Started -1 3.1 FRONT-PANEL Layout
Contents
Contents
XII
CH3
Xiii
CH1
CH2
XIV
MOD
Line
Ieee 488.2 BUS Option
CH1 Y-OUT
Main TB Gate
DTB Gate
Safety Precautions
Operators Safety
Introduction
Symbols
Impaired Safety Protection
Measuring Earth
Mains voltage cord, mains voltage range and fuses
Safety Instructions
Installation Instructions
Protective earthing
Rear View
General information
Installation of batteries
Memory BACK-UP Batteries
Front Cover
Ieee 488.2/IEC 625 BUS Interface Option
Handle Adjustment and Operating Positions of the Instrument
RS-232-C Serial Interface
Rack Mounting
Versions
Getting Started
FRONT-PANEL Layout
Switching on the Instrument
Screen control area
Screen Controls
Connect the probe as shown in figure
Auto Setup
ST5952
Mode Switching Between Analog and Digital Operating Modes
Signal Criteria Analog Mode Digital Mode
Other Criteria
Sions
Getting Started Signal Criteria Analog Mode Digital Mode
Signal with an ampli
Tude of 2 to 6.4 divi
Reconnect the probe to the Probe Adjust signal for display
Vertical Setup
AC Input Coupling
Getting Started
Timebase setup
Timebase Setup
Magnify Expand
Direct trigger setup
Direct Trigger Setup
Summary
PRE-TRIGGER View
Menu keys and softkeys
More Advanced Features
Cursor Operation
Vertical cursors ’’ or the horizontal cursors ’=’
More Advanced Trigger Functions
10 More advanced trigger setup
More Signal Detail with the Delayed Timebase
Standard Setup
Press the Status key and Text OFF key at the same time for
MTB1.00ms Ch1
Select Clear & Protect Select Clear ALL
Trace Storage
Press the Recall key
Here is how traces are stored in memory
PM3394B 200 MHz Full Four Channel Oscilloscope
HOW to USE the Instrument
PM3370B 60 MHz 2 Channel Oscilloscope
PM3390B 200 MHz 2 Channel Oscilloscope
PM3384B 100 MHz Full Four-Channel Oscilloscope
PM3380B 100 MHz 2 Channel Oscilloscope
Front Panel Layout
HOW to USE the Instrument
Simultaneously press the Status and Text OFF keys
Display and Probe Adjustments
Recall Standard Setting
Display Adjustment
Display Layout
Menus Text OFF
Off T
Press the Text OFF key three times
Repeat this adjustment for the second probe
CAL Signal and Probe Adjustment
Analog and Digital Modes
Autorange attenuator Not available Results in a
An amplitude of 2 to
Divisions
Press the Analog key again
Standard Setting
Analog to Digital Mode Switching
Press the Autoset key for optimum signal display
12HOW to USE the Instrument
Trace Storage RUN/STOP
Press the RUN/STOP key
Vertical Deflection
Press the AC DC GND key to obtain ground coupling
14HOW to USE the Instrument
Vertical Coupling AC, DC, GND
Press the AC DC GND key once for DC input coupling
Press the AC DC GND key again to obtain ac input coupling
Vertical Position
Press the upper key of the Ampl keys
16HOW to USE the Instrument
Adjust Ampl to 100 mV
Vertical Amplitude
Press the upper Ampl key once
Verticalauto Range
Vertical Variable Amplitude
Press the Auto Range key
Vertical CH1+CH2
18HOW to USE the Instrument
Press the Analog key to switch to the Digital mode
Press the Analog key to return to the analog mode
Vertical Invert
Press the ’BW LIMIT’ softkey to turn it off again
20HOW to USE the Instrument
Vertical Menu Bandwidth Limiter
Press the ’BW LIMIT’ softkey to turn it on
Connect the probe again
Vertical Probe Range Indicator
Remove the input signal from CH1
Vertical Menu
Set the timebase to 200 μs
Signal is displayed with four periods on the screen
Horizontal Deflection and Triggering
Timebase TIME/DIV
Press one of the TIME/DIV keys
Timebaseauto Range
Timebase Main TB VAR
Display of 2 to 6 waveform periods
Press the right Magnify key
24HOW to USE the Instrument
Timebase Magnify
Visible by turning the X POS control
Timebasex POS
Triggering
Turn the X POS control clockwise
26HOW to USE the Instrument
Trigger Source
Triggerslope
Turn the Trigger Level control
Trigger Trigger Level
Turn the Trigger Position control counterclockwise
Press the Analog key to select the digital mode
Set the delay to 0 with Trigger Position
Trigger Trigger Position
Trigger Single Shot
Digital Acquisition and Storage
Advanced Vertical Functions
Acquire Average
32HOW to USE the Instrument
Acquire Peak Detection
Acquire Envelope
Press the Trigger key
Trigger Mode
Press the first softkey to select ’tv’ trigger mode
Advanced Horizontal and Trigger Functions
Press the ’level-pp’ softkey to turn it off
Move the indicator T- in and out of the signal range
Trigger Mode Triggered
36HOW to USE the Instrument
Press the TB Mode key
Press the ’STOP on TRIGGER’ softkey to select ’yes’
Trigger Mode Roll
38HOW to USE the Instrument
Slowly vary the frequency of the sine-wave input signal
Trigger Line
Press the ’yes’ confirm softkey again
Memory Functions
Trace Storageclear & Protect
Press the ’yes’ confirm softkey
Select memory location ’m1’ Press the ’save’ softkey
40HOW to USE the Instrument
Trace Storage Save
Trace Storage Clear
Trace Storage Copy
Trace can be copied from one memory location to another
Press the ’COPY’ softkey
Live trace shifts
42HOW to USE the Instrument
Trace Storage Recall
Turn the POSition control
Press the Recall menu key
Trace Storage Saving Multiple Traces
Trace Storage Recalling Multiple Traces
Press the softkey next to ’yes’
44HOW to USE the Instrument
Cursors Functions
Time measurements. These can be done in digital
Cursors Time
Cursors ON/OFF
46HOW to USE the Instrument
Cursors Volt
Cursors Amplitude & Time
Cursors Readout
Press the softkey next to ’READOUT’
ΔV, V1, V2, ΔV-ratio for voltage measurements
Cursors Readout ΔT-RATIO/PHASE
48HOW to USE the Instrument
Adjust the cursors to a distance of half a signal period
Measurement Functions
Start with the standard setting.This ensures a correct start
Press the second softkey to turn MEAS1 to ’on’
50HOW to USE the Instrument
MEASUREMEAS1-PKPK
Measure MEAS1-RMS
Measure Meas 2-FREQ
Measure Delay
Remove the Probe Adjust signal from channel
Press the first softkey to select ’delay’
Measure Cursor Limit
52HOW to USE the Instrument
Measure TOUCH, Hold & Measure
Procedure to set up for TOUCH, Hold and Measure is
Processing Functions
Press the softkey next to Math 1 to enter the Math 1 submenu
Mathematics Filter
56HOW to USE the Instrument
Switch Math 2 off again
Mathematics Multiply
Analog Display Defl
Display Functions
50Hz
Digital Display
Remove the signal from channel
Digital Display Vert Magnify
60HOW to USE the Instrument
Scope ’runs’ once and a signal appears on the screen
Use the Track control to adjust Vert Magnify to
Digital Display Interpolation
Press the bottom softkey to select ’dots’
Press the bottom softkey to select ’sine’
Screen displays two or four traces now
62HOW to USE the Instrument
Connect the Probe Adjust signal to channels 1 Press Autoset
Digital Display Windows
Press the Text OFF button to turn off the menu
Delayed Timebase
Delayed Timebase
Delayed Timebase DEL’DTB has two basic functions
Press either key of the Del’dTB TIME/DIV keys
64HOW to USE the Instrument
Delayed Timebase Trace SEP
Delayed Timebase Trigger
Start with the Standard Setup
Press the Trig 1 key in the CH1 section a few times
Press the softkey to select the TRIG’D mode
Delayed Timebase Coupling
Delayed Timebase Trigger Level
First set the instrument to the standard setting
Hard Copy Facilities
SET Standard
Now you are ready to make the hard copy
Utility Print Setup
9600, 8, N, 3wire, XON/XOFF=ON
To set up the layout of the printer hard copy
HP7475A, HP7470A, Hpgl = standard HPGL, PM8277 and PM8278
Utility Plot Setup
Autoset Standard
Autoset and Setup Utilities
Position the trace in the bottom of the screen
Setups
72HOW to USE the Instrument
Autoset User Programmable
To recall a previously stored setting
This setup can be saved in memory as follows
Autocal
Setup Text Label
Setup Recall a Sequence
74HOW to USE the Instrument
Other Features
Function Reference
Function Reference
Description
Acquisition Length
Key sequence
Memory Expansion
Toggle key to switch the inverted display of CH2 CH4 on/off
ADD Invert Subtract
INV
ADD Mathematics
Mathematical description
Result = S1 + S2
CPL QW Command to query a waveform Refer to for full details
Remote commands
ALT/CHOP
Analog Mode
Toggle softkey to select ALTernate or CHOPped mode
Alternate and chopped modes are shown in the figures below
Auto Range
Toggle key to switch between analog mode and digital mode
Auto Range
Analog
Key to start the autoset
CPL AS Command for Auto Setup Refer to for full details
Autoset
Autoset
Autoset Sequence
Trig
Autoset Userprog
Utilityautoset
Vert
Autoset
CPL AS Command for an Auto Setup Refer to for full details
Control to select the Average factor
Key to switch the Average function on or off
Effect of bandwidth limiter
CPL CL Command for Calibrate Refer to for full details
Calibration Autocal
CAL
CHANNEL/TRACE Selection
Confidence Check
Power on OFF
Cursors
More than one channel is on, Desired channel for voltage
Cursors
Volt cursors are used for
Voltage measurements. When
Track
Function Reference Cursors Both
Measured
Cursors Readout Time
Function Reference Cursors Readout Volt
Trigger position
Delay
Full description is given under Delayed Timebase
Event delay
CH1 Slope
Delay Measurement
Delayed Timebase DEL’D TB
Delay
Function of ’mtb+dtb’, Delay and Trace SEP
Toggle switch to switch between analog mode and digital mode
Digital Mode
Interpolation
Display Menu
Lines are drawn between sample points
Display Text
Amplitude variation AM Variation FM or jitter
Display of signal with
External Trigger 2 Channels Models only
Trig View
Ampl
Filter
Glitch Trigger
Hold OFF
Using Hold OFF to suppress double triggering
Control to adjust Main TB hold off time
Hold OFF
Function of key pair AMPL/VAR
Input Attenuator Manual + Automatic
Range
Toggle key to switch the Auto Range function on/off
Input Coupling
Auto
AC/DC
Toggle key to switch a channel on/off
Input Impedance 200 MHZ Models only
AC/DC/GND
Logic Trigger 4 Channels Models only
State
Pattern
Refer to Glitch Trigger function
To adjust t2
Ift2
Glitch
Function of the timebase magnifier and X POS control
Magnify Horizontal
Control to select the vertical magnification
Magnify Vertical
Left side decreases the Magnify factor
Function of vertical magnifier and Y POS control
VAR ns
Main Timebase Manual + Automatic
46FUNCTION Reference
Function of key pair TIME/DIV VAR
Measure Menu
Mathematics
Following measurements are available
Volt
Positive and negative, preshoot positive and negative
Multiply Mathematics
Result = S1 x S2
Peak Detection
POS
Toggle key to switch the peak detection on/off
Power Supply
Toggle key to switch the oscilloscope on/off
Printing and Plotting
Interface
Printer or plotter
Layout
Real-time clock
Toggle softkey to plot trace information
Probe Utilities
Status
Remote Control Ieee
Key to switch from remote to local
Control to select the Ieee device address
Remote Control RS-232
Parity
Odd Even
LL Inhibits front key Status Local Refer to for full details
RUN/STOP
Trace Rotation
Rise time measurement using the graticule
Screen Controls and Graticule
Screen controls and function
Autocal Necessary
Auto Setting
Screen Messages
Always Parity if 7 Bits
No Average in Roll Mode
Auto Setting Userprogram
Calibration Error
KEY Inactive When Stopped
No Event Delay in TV Mode
No DTB in Roll Mode
No Envelope in Roll Mode
No Event DELAY, Dual Slope
TIME/DIV Adjusted
Setup Empty
Setup Protected
STD Setup = Recall only
Setups Track
Setups Sequence
Standard Setup / Front Panel Reset
Softkey to recall ’std’ settings
Std memory selection
Status Screen
Subtract mode is available in the digital mode of operation
Subtract Mathematics
Result = S1 S2
Control to select the Subtract process
Text OFF
Timebase Modes
Acquired waveform is stored in a different memory location
Flows ‘through’ the screen from left to right. When Roll is
Selected, the TB Mode menu provides a ‘STOP on TRIGGER’
TRIGGER’ is set to ‘on’, the trace stops when the scope is
Time Measurements
Function Reference
Time
TOUCH, Hold & Measure Mode
Trigger Coupling
Ac dc lf-rej Trigger hf-rej
Trigger DEL’D TB
Delay
Toggle softkey to switch DEL’D TB ’on’
Trigger Level control ranges in level-pp on and off
Trigger Main TB
Edge
Function of Trigger Level and slope
Trig Toggle key to select CH1, CH.. or Exttrig as Main TB
Slope to change between positive and negative trigger
TV Trigger
Key sequence
Usertext
Utility Maintenance
Util Menu
Utility Screen & Sound
Sn = nth sample j=n=k
Volt Measurements
× S n
Oversh Overshoot
100%
Falling presh =
Limit
Deflection X-DEFL, X vs Y
Toggle softkey to switch X vs Y on
CPL Protocol
Commands
Program data separator
Acknowledge
Responses
Data Separators
Program frame
Example Program Frame
4THE CPL Protocol
Commands in Functional Order
Commands in Alphabetical Order
Name
Command Reference
Acknowledge
Command Response
8THE CPL Protocol
ARM Trigger
Calibrate
10THE CPL Protocol
Default Setup
GO to Local
12THE CPL Protocol
GO to Remote
Identity string
Identification
Example response
Local Lockout
HWL
Program Communication
16THE CPL Protocol
Xonxoff
Approx .5 sec after an acknowledge = 0 is received,
Pds Count Node
Program Setup
18THE CPL Protocol
Count Node
Program Text
Pds
Char
Char Character Description
Examples of user text
Pds Wavenr
Sample checksum Admin Pds Count
Program Waveform
22THE CPL Protocol
Action by Parameter Type Example Oscilloscope Notes
Example
LSB = Sample and &HFF
Example program
Numerical values of an infinite number of measurement
Results is returned cancelling is possible by sending Ascii
Query Measurement
26THE CPL Protocol
Value Parameter specified Value,value
T2-trg
Example of a single measurement
Measvalue
Point notation, e.g E-09
Or Hz
Null
Query Print
Example Written in Quick Basic
30THE CPL Protocol
Query Setup
Count Number of strings to follow Node
Oscilloscope, e.g =10 hex
Example response PM3394
Complete setup query
User text is returned
Query Text
Printed, e.g
Query Waveform
Admin Count Sample Checksum
Parameter Type Example
Wavenr The oscilloscope waveform source
Input #1,NM$
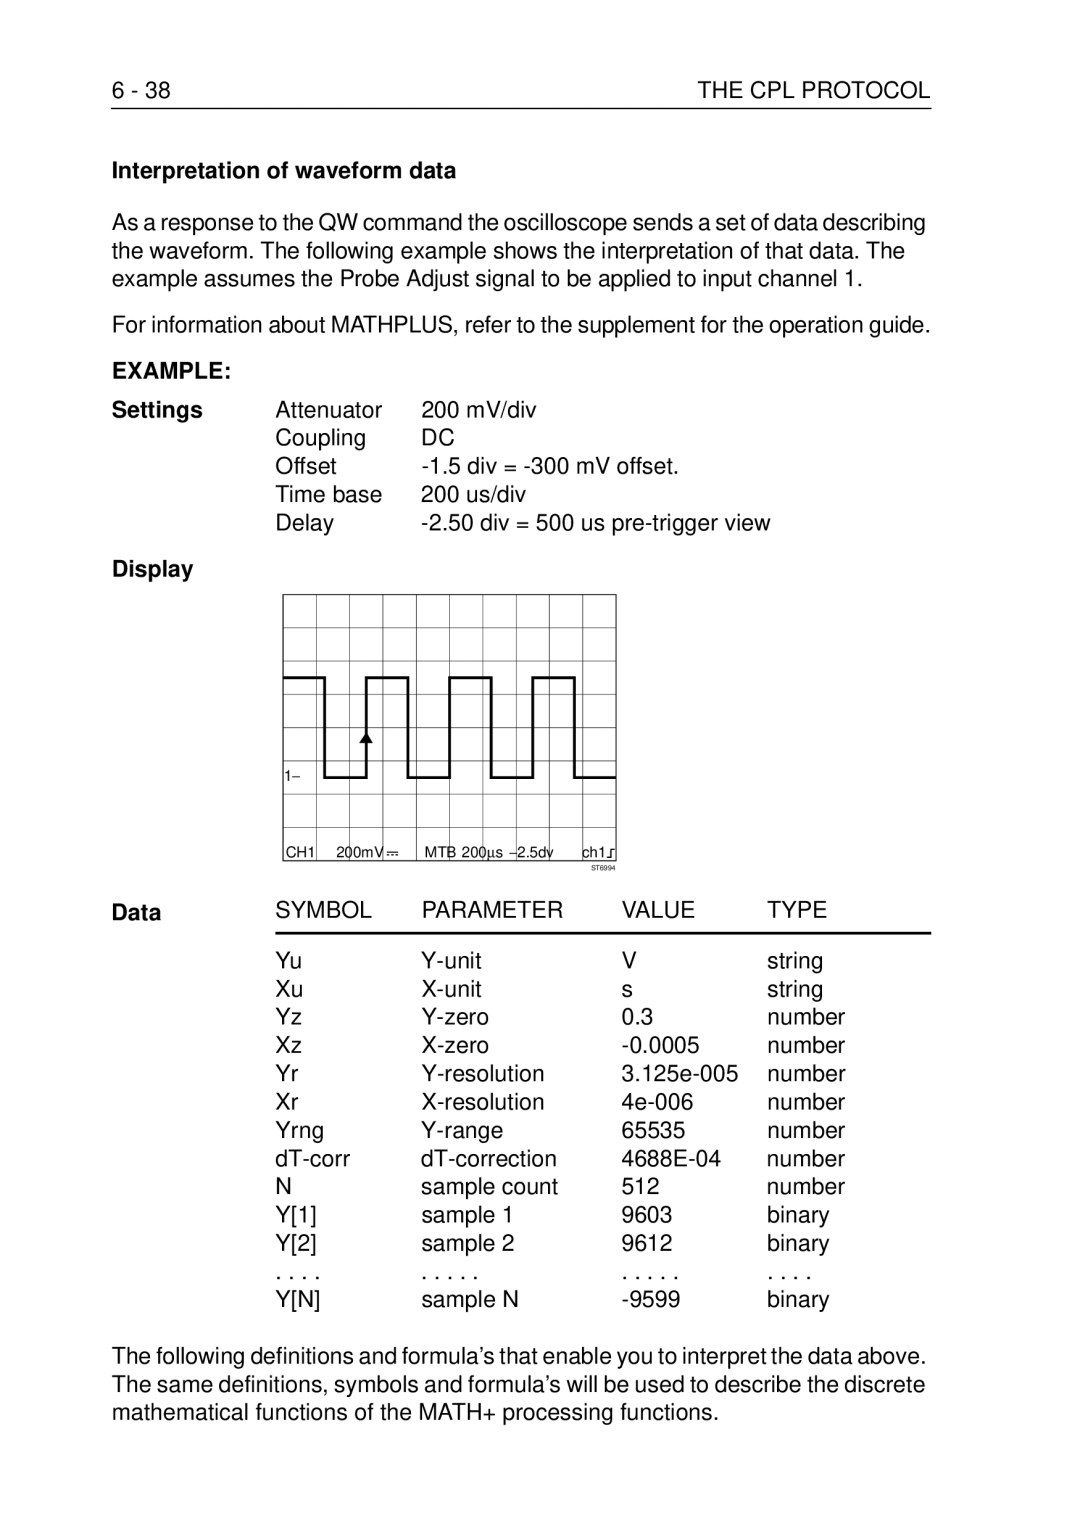
Display
Settings
Symbol Parameter Value Type
Interpretation of waveform data
Sensitivity
Definitions
Formula’s
Sn = Yz + Yn * Yr * Yu
Time base = 50 * Xr * Xu/div
Time base
Reset Instrument
Recall Setup
Pds Setup reg
42THE CPL Protocol
Represents the setup register number, ranging from 1
Save Setup
44THE CPL Protocol
Status
Example status
46THE CPL Protocol
Trigger Acquisition
Acknowledge
Ok, normal situation Syntax error
Execution error
Synchronization error
Status
Example program to investigate status
Main Timebase settings
Setup
Common vertical settings
Common horizontal settings
Measurement 1 settings Measurement 2 settings
Hex Dec Meaning Events Trigger Delay settings
Cursor settings
Cursor autosearch settings
Nnllxxxxxx.......xx
Acquire Menu Structure
Appendix a Acquire menu structure
Digital
Appendix B Cursors menu structure
Cursors menu structure
Display Menu Structure
Appendix C Display menu structured
Mathematics Menu Structure
Appendix D Mathematics menu structure
Measure Menu Structure
Appendix F DTB DEL’D TB menu structure
SAVE/RECALL Menu Structure
Setups Menu Structure
Appendix H Setups menu structure
TB Mode Menu Structure
Appendix J TB Mode menu structure
Div T
Appendix K Trigger menu structure
Trigger menu structure
Appendix L Utility menu structure
Utility menu structure
Vertical Menu Structure
Vert Menu Vertical BW Limit
On off 50Ω CH1 50Ω CH2 50Ω CH3 50Ω CH4
DTR
RS-232 Cable Configurations
RTS
CTS
Cable to controller with hardware handshake
Cable to printer/plotter with hardware handshake
Channels Simultaneously Sampled AT 100 MS/s
Appendix P
Channel Acquisitions
Expansion and Interpolation
Function Index
Function Index see Chapter
Function Index
Index
Measure Menu Time Measuremens Volt Measurements
TOUCH, Hold & Measure Mode
Delayed Timebase Trigger DEL’D TB
Display and Probe Adjustment Display Functions Display Menu
Glitch Trigger GND Input Coupling
Printing and Plotting Remote Control Ieee
Installation Instructions Appendix N
Util Maintenance
Memory BACK-UP Batteries
CHANNEL/TRACE Selection Setups
Printing and Plotting Remote Control RS-232
Memory Functions
Timebase Modes
Autoset and Setup Utilities Setups Setups Sequence
Timebase Modes Delayed Timebase
Screen Messages Utility Screen & Sound
Display Menu Deflection
8FUNCTION Index
Advanced Vertical Functions
Cursors Readout Measure Menu Volt Measurements