| 11: Monitor |
Presenting |
|
STEP 1 - STRATEGY |
|
Here you consider your options for sharing the data | Figure |
you have mined. For human users, a Web page |
|
presentation is simplest. For |
|
communication, XML might be best. Command Line |
|
could be used for either. |
|
STEP 2 - SETUP |
|
Automatically your data is available under status on the Web Manager, XML, and CLI.
Advanced Web customization can be done with HTML and JavaScript files dropped into the xPico
STEP 3 - TEST
With the Web Manager, view all of your data under Monitor Status.
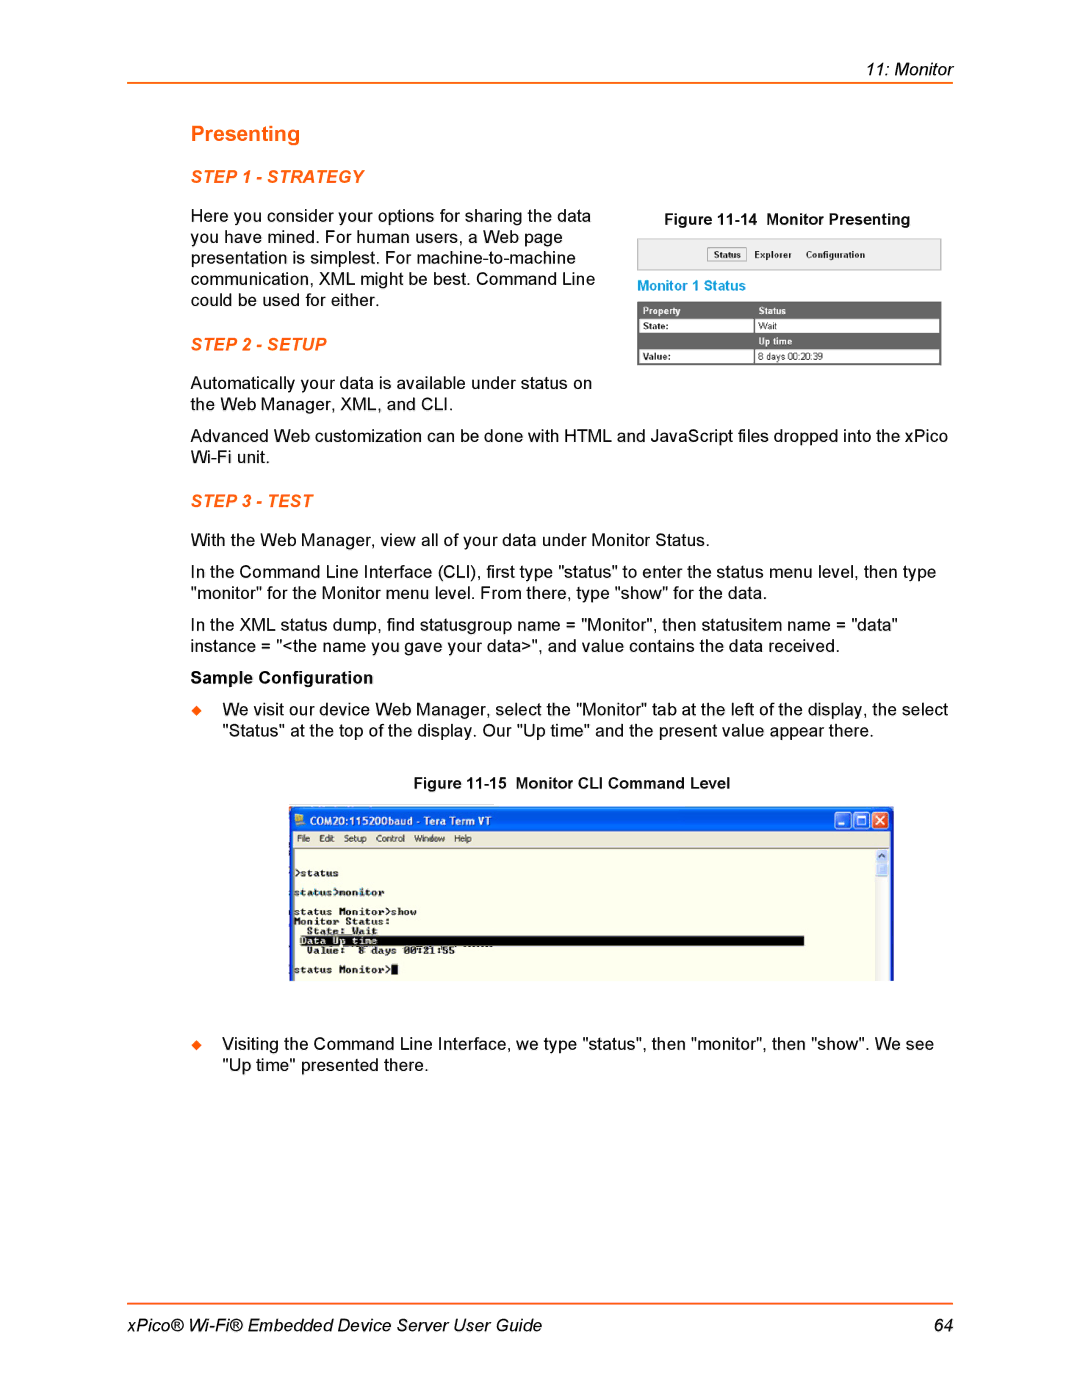
In the Command Line Interface (CLI), first type "status" to enter the status menu level, then type "monitor" for the Monitor menu level. From there, type "show" for the data.
In the XML status dump, find statusgroup name = "Monitor", then statusitem name = "data" instance = "<the name you gave your data>", and value contains the data received.
Sample Configuration
We visit our device Web Manager, select the "Monitor" tab at the left of the display, the select "Status" at the top of the display. Our "Up time" and the present value appear there.
Figure 11-15 Monitor CLI Command Level
Visiting the Command Line Interface, we type "status", then "monitor", then "show". We see "Up time" presented there.
xPico® | 64 |
