Chapter 7: Magnum Router GUI Manager
___________________________________________________________________
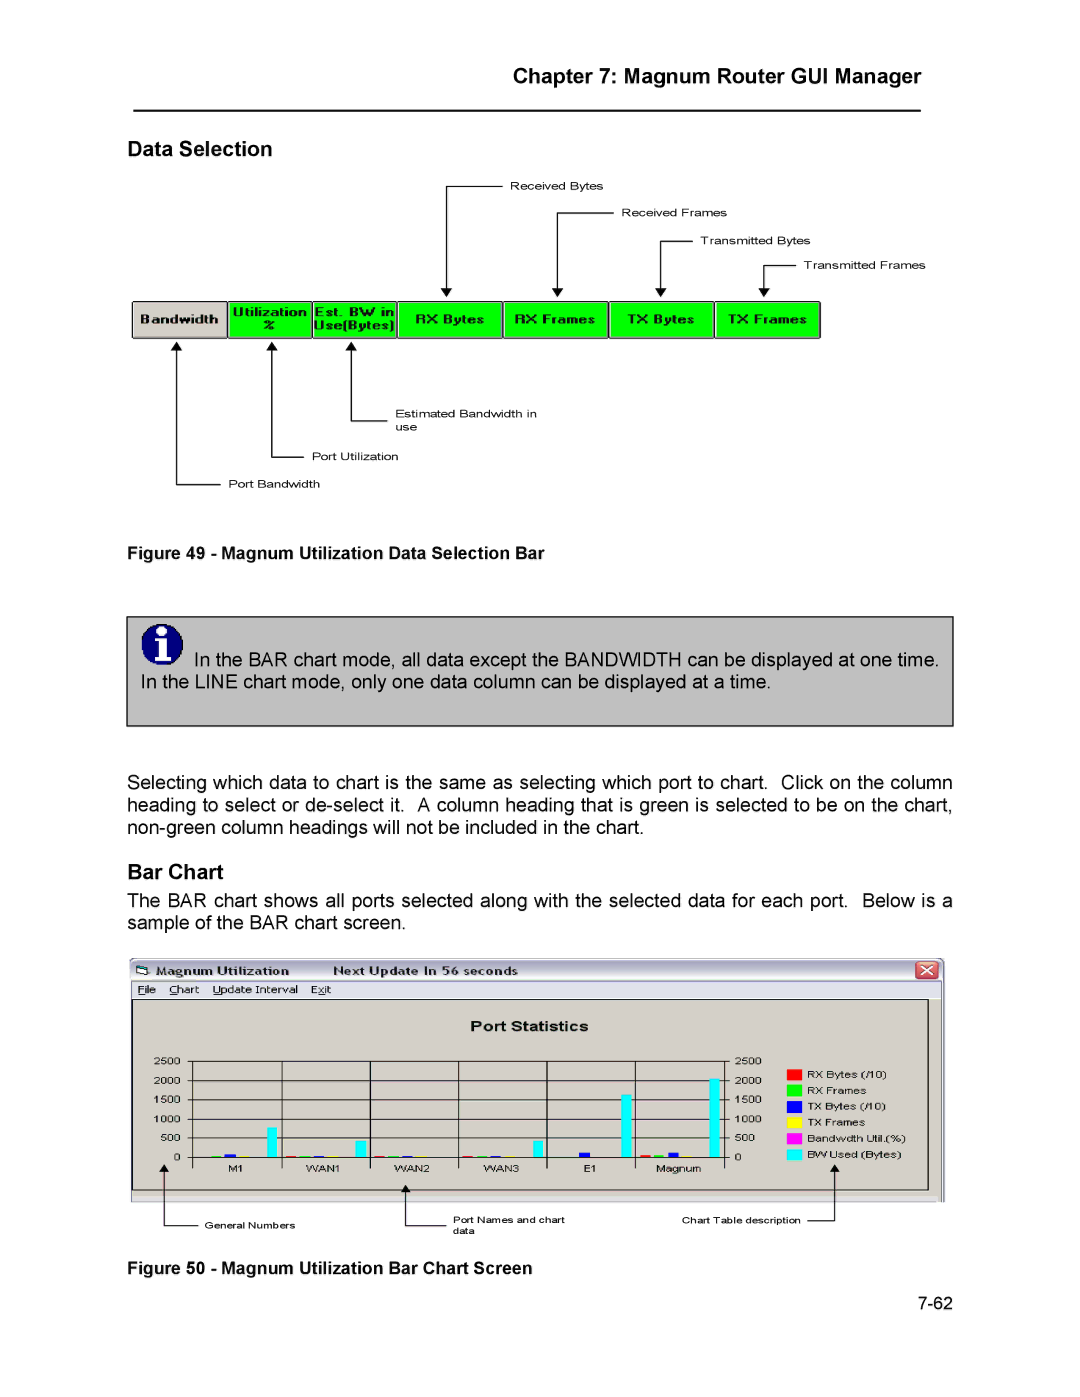
Data Selection
Received Bytes
Received Frames
Transmitted Bytes
Transmitted Frames
Estimated Bandwidth in use
Port Utilization
Port Bandwidth
Figure 49 - Magnum Utilization Data Selection Bar
![]() In the BAR chart mode, all data except the BANDWIDTH can be displayed at one time. In the LINE chart mode, only one data column can be displayed at a time.
In the BAR chart mode, all data except the BANDWIDTH can be displayed at one time. In the LINE chart mode, only one data column can be displayed at a time.
Selecting which data to chart is the same as selecting which port to chart. Click on the column heading to select or
Bar Chart
The BAR chart shows all ports selected along with the selected data for each port. Below is a sample of the BAR chart screen.
General Numbers
Port Names and chart | Chart Table description |
data |
|
