Chapter 7: Magnum Router GUI Manager
___________________________________________________________________
Line Chart
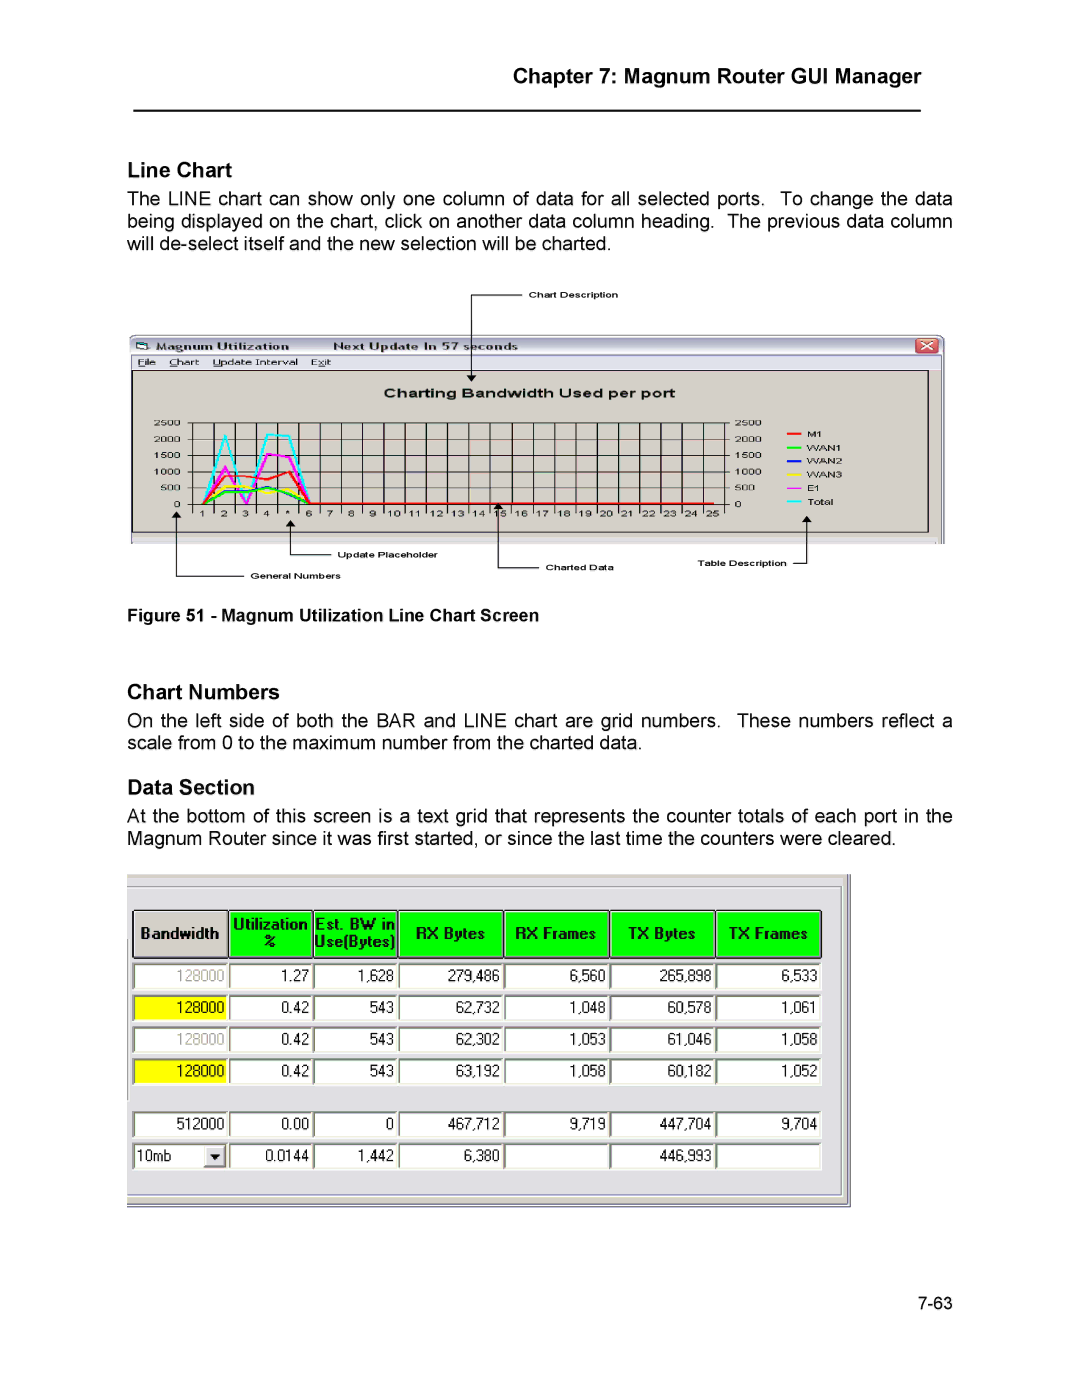
The LINE chart can show only one column of data for all selected ports. To change the data being displayed on the chart, click on another data column heading. The previous data column will
Chart Description
Update Placeholder
General Numbers
Charted Data | Table Description |
|
Figure 51 - Magnum Utilization Line Chart Screen
Chart Numbers
On the left side of both the BAR and LINE chart are grid numbers. These numbers reflect a scale from 0 to the maximum number from the charted data.
Data Section
At the bottom of this screen is a text grid that represents the counter totals of each port in the Magnum Router since it was first started, or since the last time the counters were cleared.
