Chapter 4
PC-IP Operation
49
The user may manually position the markers. The typical marker setup is to place M1 at the upstream frequency with the BW (bandwidth) set according to the upstream signal’s occupied bandwidth, using the average power detector (for QAM, QPSK or noise measurements). M2 is set to the frequency of expected ingress or distortion with a 0 MHz bandwidth, using the peak detector. M3 is set to the frequency expected to allow a noise floor measurement (empty spectrum, but within the diplex filter and return amplifier’s frequency range), with the bandwidth matching the upstream signal and the detector set to average power. Again the user can adjust the markers, as required, when the Return Spectrum mode is initialized.
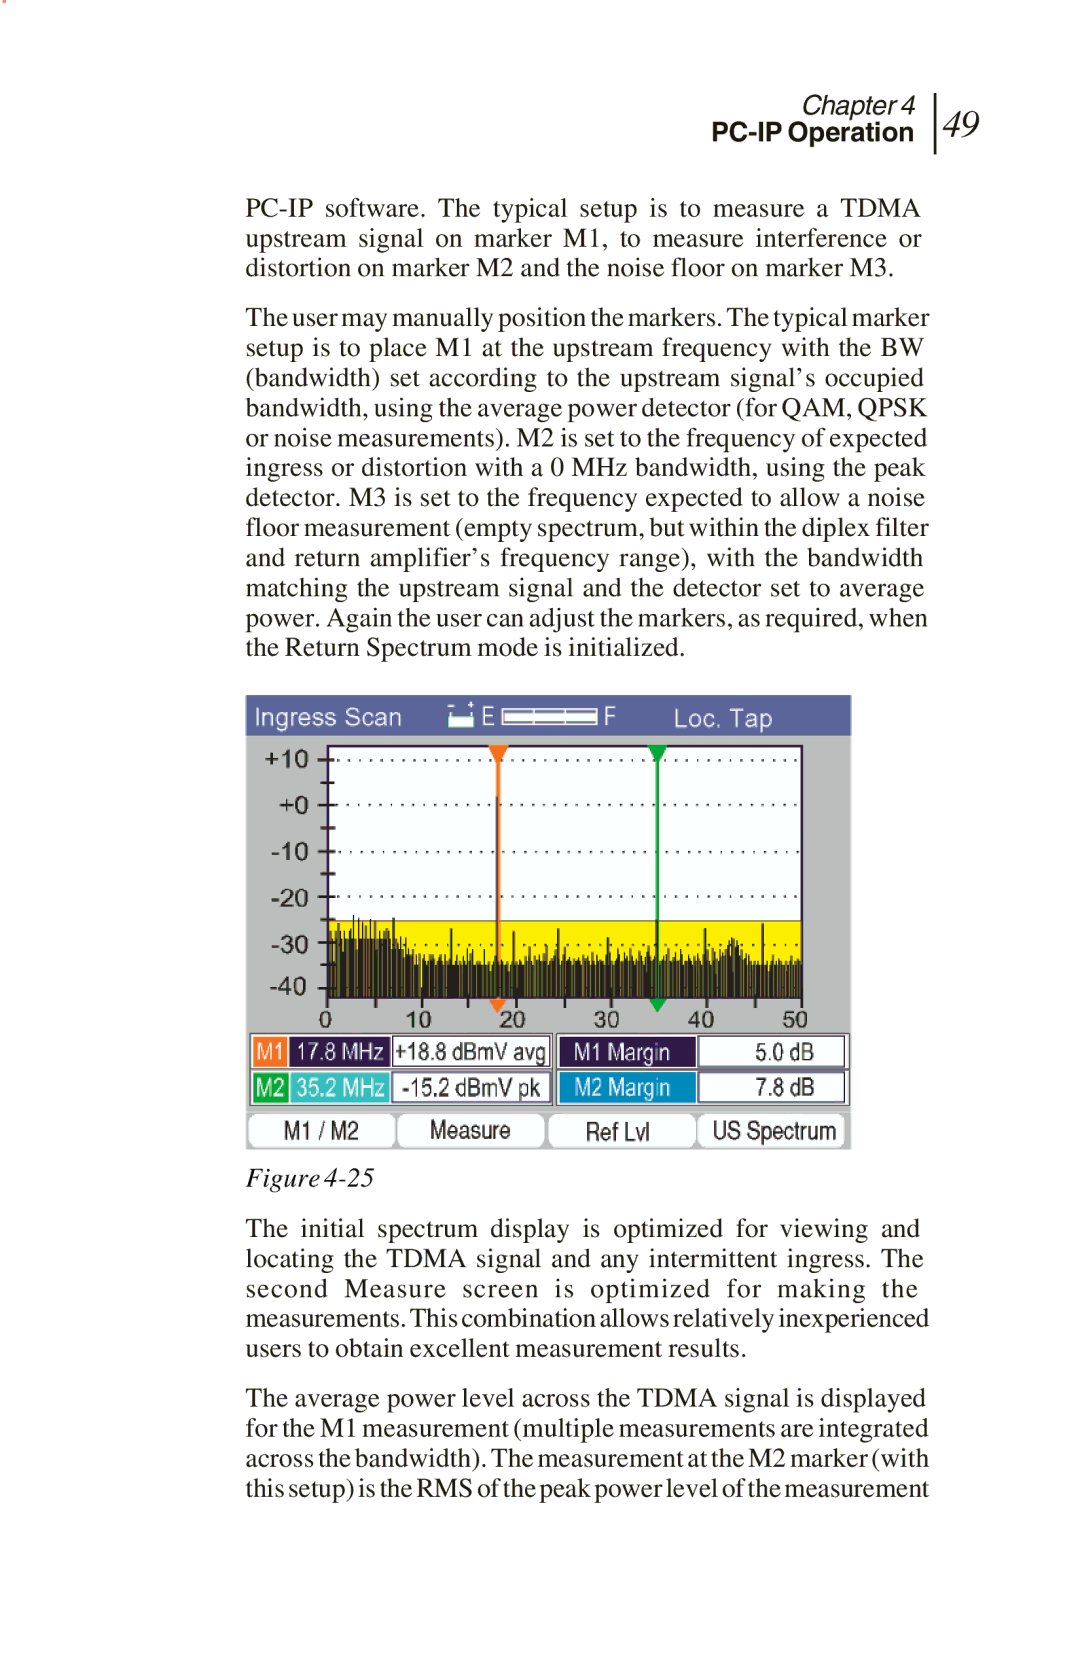
Figure
The initial spectrum display is optimized for viewing and locating the TDMA signal and any intermittent ingress. The second Measure screen is optimized for making the measurements. This combination allows relatively inexperienced users to obtain excellent measurement results.
The average power level across the TDMA signal is displayed for the M1 measurement (multiple measurements are integrated across the bandwidth). The measurement at the M2 marker (with this setup) is the RMS of the peak power level of the measurement