70
User’s Manual
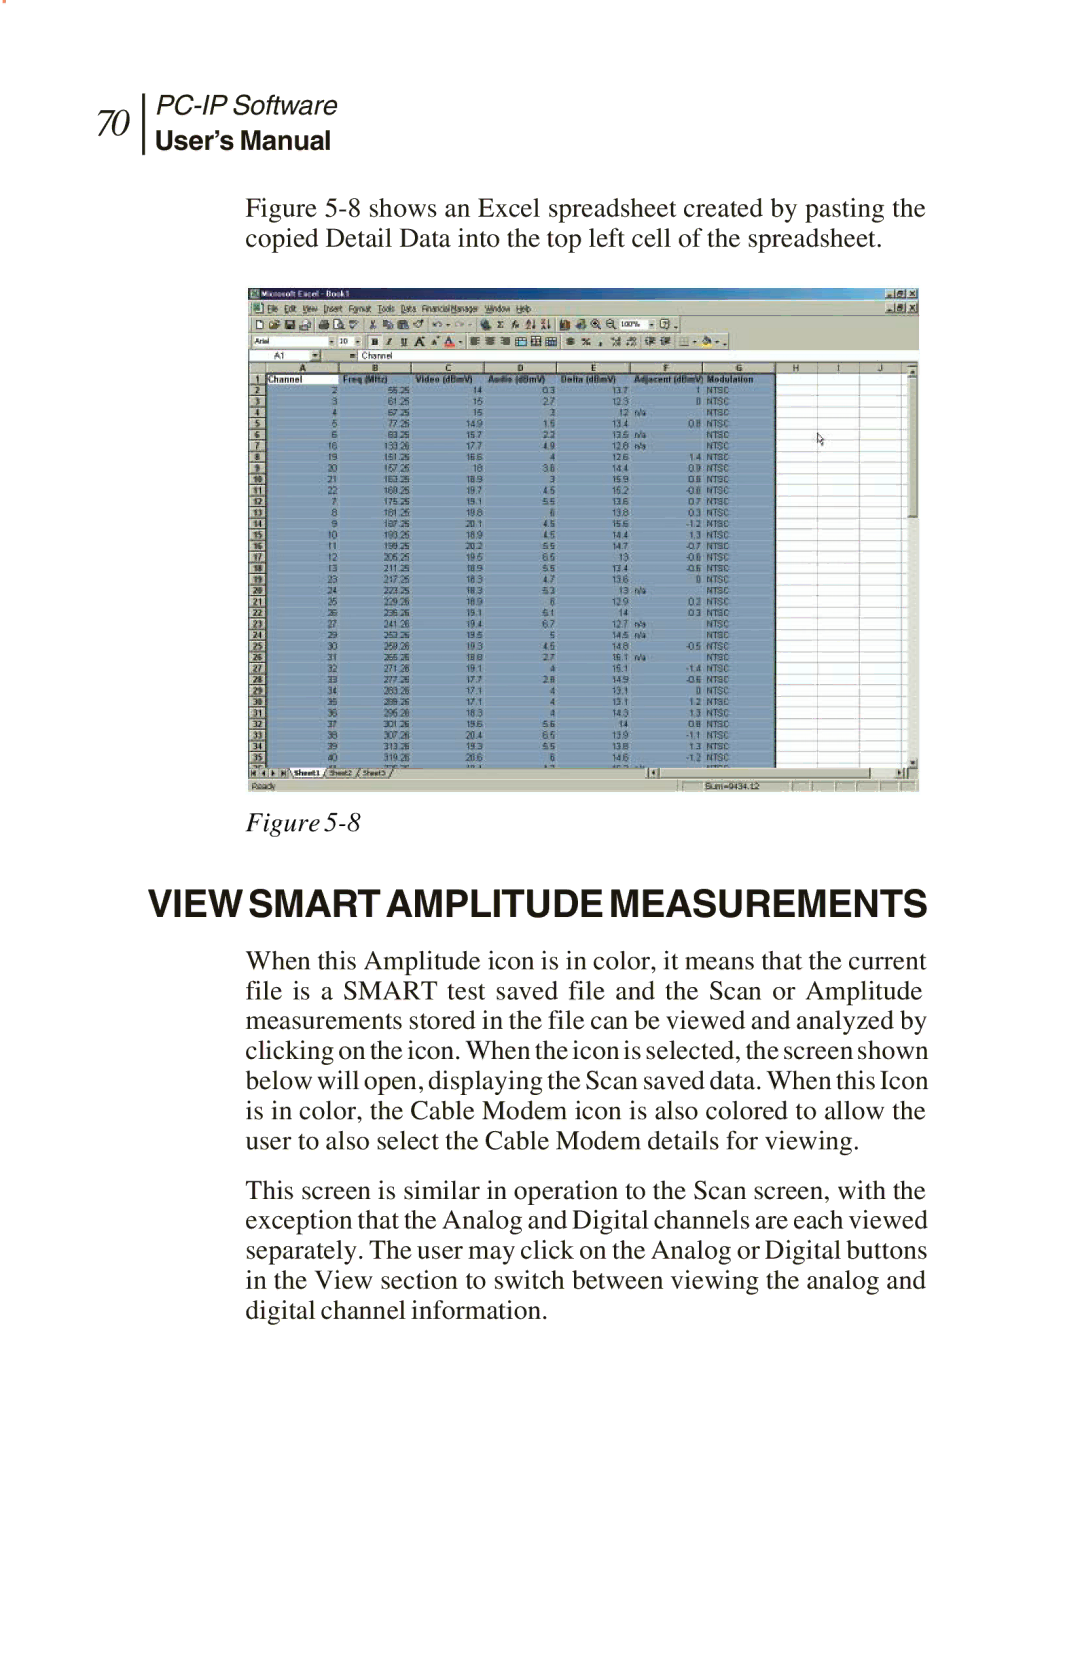
Figure 5-8 shows an Excel spreadsheet created by pasting the copied Detail Data into the top left cell of the spreadsheet.
Figure
VIEW SMART AMPLITUDE MEASUREMENTS
When this Amplitude icon is in color, it means that the current file is a SMART test saved file and the Scan or Amplitude measurements stored in the file can be viewed and analyzed by clicking on the icon. When the icon is selected, the screen shown below will open, displaying the Scan saved data. When this Icon is in color, the Cable Modem icon is also colored to allow the user to also select the Cable Modem details for viewing.
This screen is similar in operation to the Scan screen, with the exception that the Analog and Digital channels are each viewed separately. The user may click on the Analog or Digital buttons in the View section to switch between viewing the analog and digital channel information.