Data Panels
Data Panels
Description
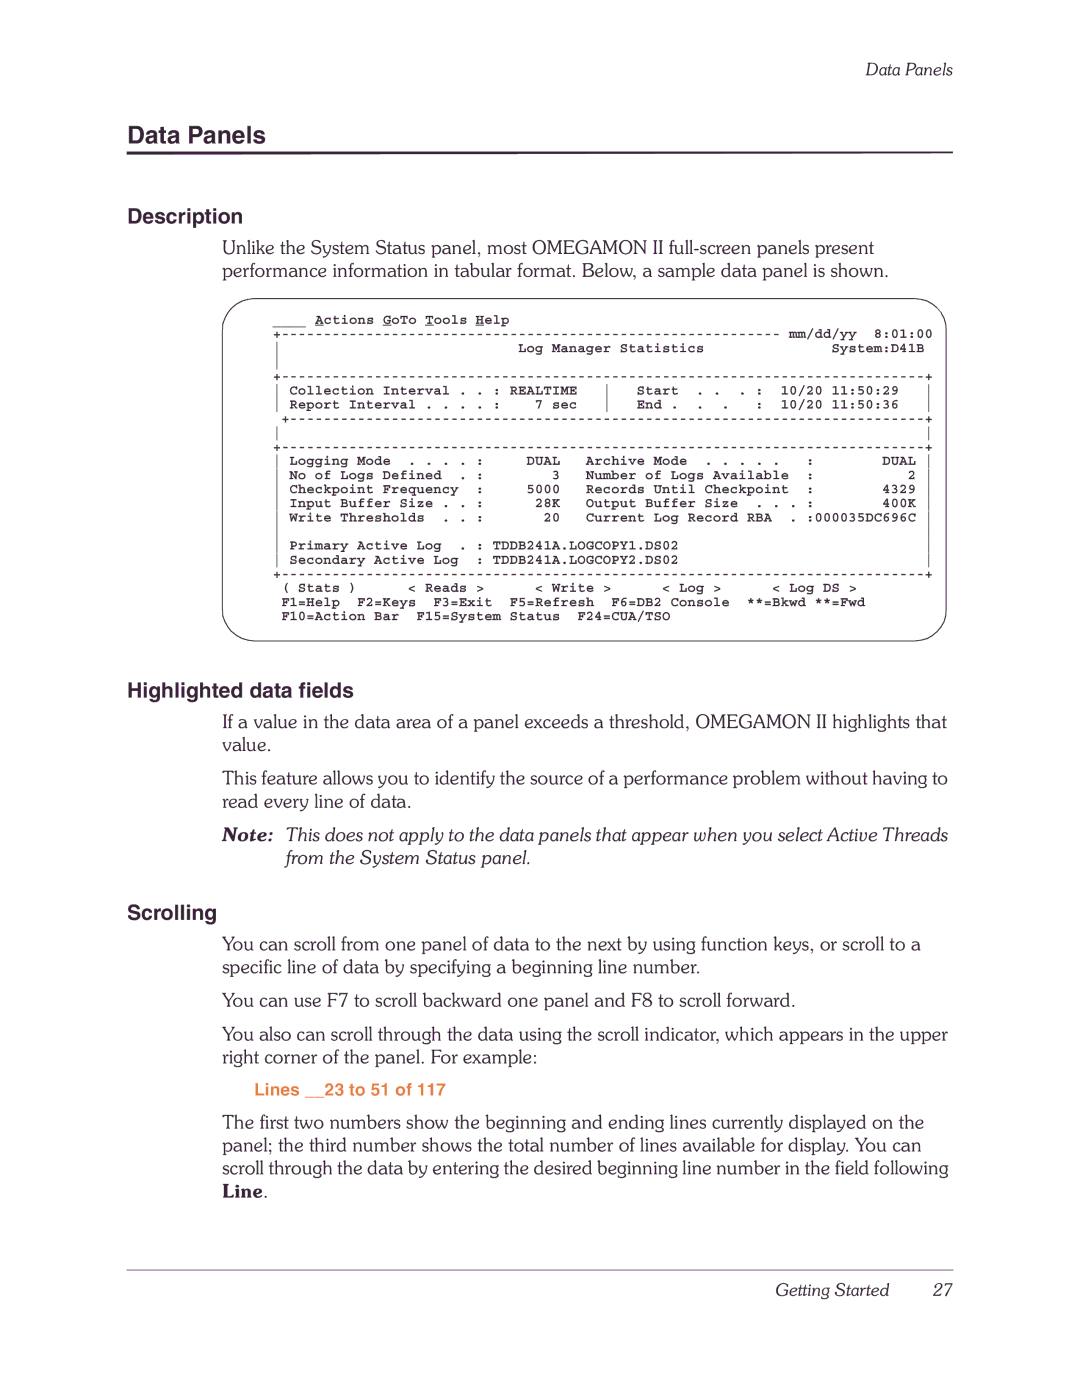
Unlike the System Status panel, most OMEGAMON II
____ Actions GoTo Tools Help |
|
|
|
|
|
|
|
| ||
|
|
|
|
|
| mm/dd/yy | 8:01:00 | |||
|
| Log Manager Statistics |
|
| System:D41B |
| ||||
|
|
|
|
|
|
|
|
|
| |
|
|
|
|
|
|
|
| + | ||
Collection Interval | . . | : REALTIME | Start . . | . : | 10/20 11:50:29 | |||||
Report Interval . . | . . | : | 7 sec | End . . . | : | 10/20 11:50:36 | ||||
|
|
|
|
|
|
|
| + | ||
|
|
|
|
|
|
|
|
| ||
|
|
|
|
|
|
|
| + | ||
Logging Mode . . . . : |
| DUAL | Archive Mode |
| : | DUAL | ||||
No of Logs Defined | . : |
| 3 | Number of Logs Available | : | 2 | ||||
Checkpoint Frequency | : |
| 5000 | Records Until Checkpoint | : | 4329 | ||||
Input Buffer Size . | . : |
| 28K | Output Buffer Size | . . . : | 400K | ||||
Write Thresholds . . : |
| 20 | Current Log Record RBA |
| . :000035DC696C | |||||
|
|
|
|
|
|
|
|
| ||
Primary Active Log | . : TDDB241A.LOGCOPY1.DS02 |
|
|
|
| |||||
Secondary Active Log | : TDDB241A.LOGCOPY2.DS02 |
|
|
|
| |||||
|
|
|
|
|
|
|
| + | ||
( Stats | ) | < Reads > | < Write | > | < Log > | < Log DS > | |
F1=Help |
| F2=Keys | F3=Exit | F5=Refresh |
| F6=DB2 Console | **=Bkwd **=Fwd |
F10=Action Bar | F15=System | Status F24=CUA/TSO |
| ||||
Highlighted data fields
If a value in the data area of a panel exceeds a threshold, OMEGAMON II highlights that value.
This feature allows you to identify the source of a performance problem without having to read every line of data.
Note: This does not apply to the data panels that appear when you select Active Threads from the System Status panel.
Scrolling
You can scroll from one panel of data to the next by using function keys, or scroll to a specific line of data by specifying a beginning line number.
You can use F7 to scroll backward one panel and F8 to scroll forward.
You also can scroll through the data using the scroll indicator, which appears in the upper right corner of the panel. For example:
Lines __23 to 51 of 117
The first two numbers show the beginning and ending lines currently displayed on the panel; the third number shows the total number of lines available for display. You can scroll through the data by entering the desired beginning line number in the field following Line.
Getting Started | 27 |
