Monitoring from the System Status Panel
Monitoring from the System Status Panel
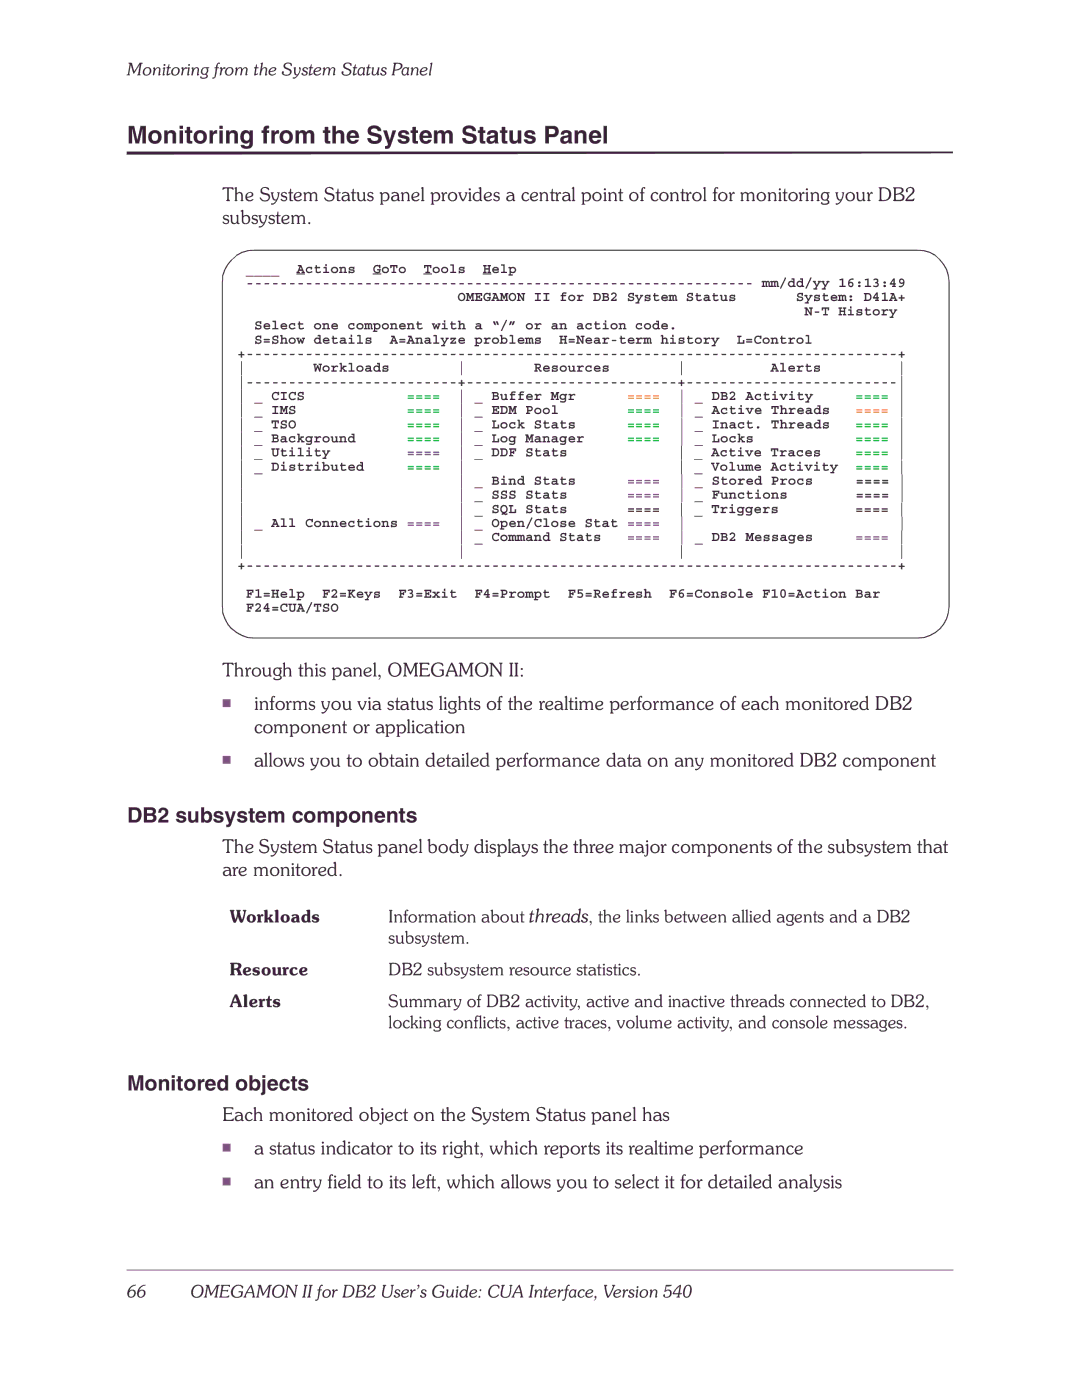
The System Status panel provides a central point of control for monitoring your DB2 subsystem.
|
| mm/dd/yy 16:13:49 | |||||||
|
|
|
|
|
|
|
| ||
|
|
| OMEGAMON II for DB2 | System Status | System: D41A+ | ||||
Select one component with | a “/” or an action code. | ||||||||
|
| ||||||||
S=Show details | A=Analyze | problems | L=Control |
| |||||
|
|
|
|
|
|
| + | ||
Workloads |
| Resources |
| Alerts | |||||
| + |
| |||||||
_ CICS |
| ==== | _ Buffer Mgr | ==== | _ DB2 Activity | ==== | |||
_ IMS |
| ==== | _ EDM Pool |
| ==== | _ Active Threads | ==== | ||
_ TSO |
| ==== | _ Lock Stats | ==== | _ Inact. Threads | ==== | |||
_ Background | ==== | _ Log Manager | ==== | _ Locks | ==== | ||||
_ Utility | ==== | _ DDF Stats |
| _ Active Traces | ==== | ||||
_ Distributed | ==== |
|
|
| _ Volume Activity | ==== | |||
|
| _ Bind Stats | ==== | _ Stored Procs | ==== | ||||
|
| _ SSS Stats | ==== | _ Functions | ==== | ||||
|
| _ SQL Stats | ==== | _ Triggers | ==== | ||||
_ All Connections ==== | _ Open/Close Stat | ==== |
| ||||||
|
| _ Command Stats | ==== | _ DB2 Messages | ==== | ||||
|
|
|
|
|
| ||||
|
|
|
|
|
|
| + | ||
F1=Help | F2=Keys | F3=Exit |
| F4=Prompt | F5=Refresh | F6=Console F10=Action | Bar | ||
F24=CUA/TSO
Through this panel, OMEGAMON II:
■informs you via status lights of the realtime performance of each monitored DB2 component or application
■allows you to obtain detailed performance data on any monitored DB2 component
DB2 subsystem components
The System Status panel body displays the three major components of the subsystem that are monitored.
Workloads | Information about threads, the links between allied agents and a DB2 |
| subsystem. |
Resource | DB2 subsystem resource statistics. |
Alerts | Summary of DB2 activity, active and inactive threads connected to DB2, |
| locking conflicts, active traces, volume activity, and console messages. |
Monitored objects
Each monitored object on the System Status panel has
■a status indicator to its right, which reports its realtime performance
■an entry field to its left, which allows you to select it for detailed analysis