Reviewing
Reviewing Near-Term History Data
Note: To display
Accessing near-term history data
To access
The following is an example of how to access
■Select a connection type under Workloads with the H action code, and press Enter. Result: The Thread History by Report Interval panel appears.
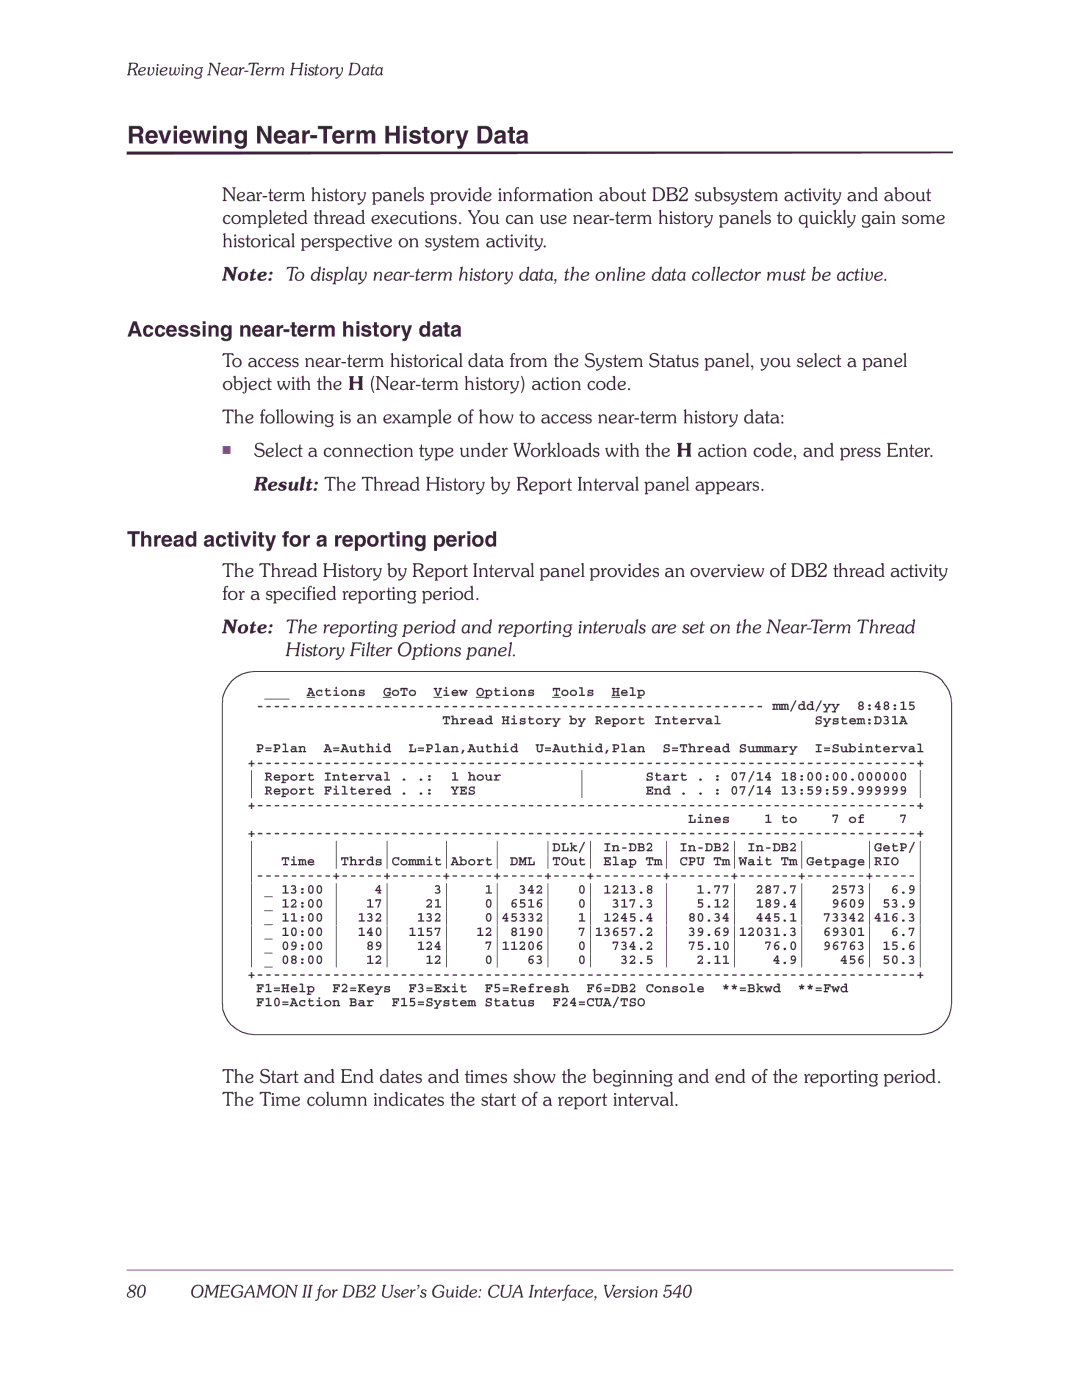
Thread activity for a reporting period
The Thread History by Report Interval panel provides an overview of DB2 thread activity for a specified reporting period.
Note: The reporting period and reporting intervals are set on the
| Tools | Help |
|
| mm/dd/yy 8:48:15 | ||||||||
|
|
|
|
|
|
|
|
|
|
| |||
|
|
|
| Thread History by Report Interval |
| System:D31A | |||||||
| P=Plan | A=Authid | L=Plan,Authid U=Authid,Plan | S=Thread Summary | I=Subinterval | ||||||||
+ |
|
|
|
|
|
|
|
|
|
| + | ||
Report Interval | . .: | 1 hour |
| Start . : 07/14 18:00:00.000000 | |||||||||
Report Filtered | . .: | YES |
| End | . . : 07/14 13:59:59.999999 | ||||||||
+ |
|
|
|
|
|
|
|
|
|
| + | ||
|
|
|
|
|
|
|
|
|
| Lines | 1 to | 7 of | 7 |
+ |
|
|
|
|
|
|
|
|
|
| + | ||
| DLk/ | GetP/ | |||||||||||
Time | ThrdsCommitAbort | DML TOut | Elap Tm | CPU TmWait TmGetpageRIO | |||||||||
+ | + | ||||||||||||
_ 13:00 | 4 | 3 | 1 | 342 | 0 | 1213.8 | 1.77 | 287.7 | 2573 | 6.9 | |||
_ 12:00 | 17 | 21 | 0 | 6516 | 0 | 317.3 | 5.12 | 189.4 | 9609 53.9 | ||||
_ 11:00 | 132 | 132 | 045332 | 1 | 1245.4 | 80.34 | 445.1 | 73342416.3 | |||||
_ 10:00 | 140 | 1157 | 12 | 8190 | 713657.2 | 39.6912031.3 | 69301 | 6.7 | |||||
_ 09:00 | 89 | 124 | 711206 | 0 | 734.2 | 75.10 | 76.0 | 96763 15.6 | |||||
_ 08:00 | 12 | 12 | 0 | 63 | 0 | 32.5 | 2.11 | 4.9 | 456 50.3 | ||||
+ | F2=Keys | F3=Exit F5=Refresh F6=DB2 Console **=Bkwd **=Fwd | + | ||||||||||
|
| ||||||||||||
| F10=Action Bar | F15=System Status | F24=CUA/TSO |
|
|
|
|
| |||||
The Start and End dates and times show the beginning and end of the reporting period. The Time column indicates the start of a report interval.