Monitoring from the System Status Panel
Status indicators
A status indicator is a color bar or a word (for example, Warn) that represents the performance of your DB2 subsystem. Color terminals can display both colors and words; noncolor terminals can display only words.
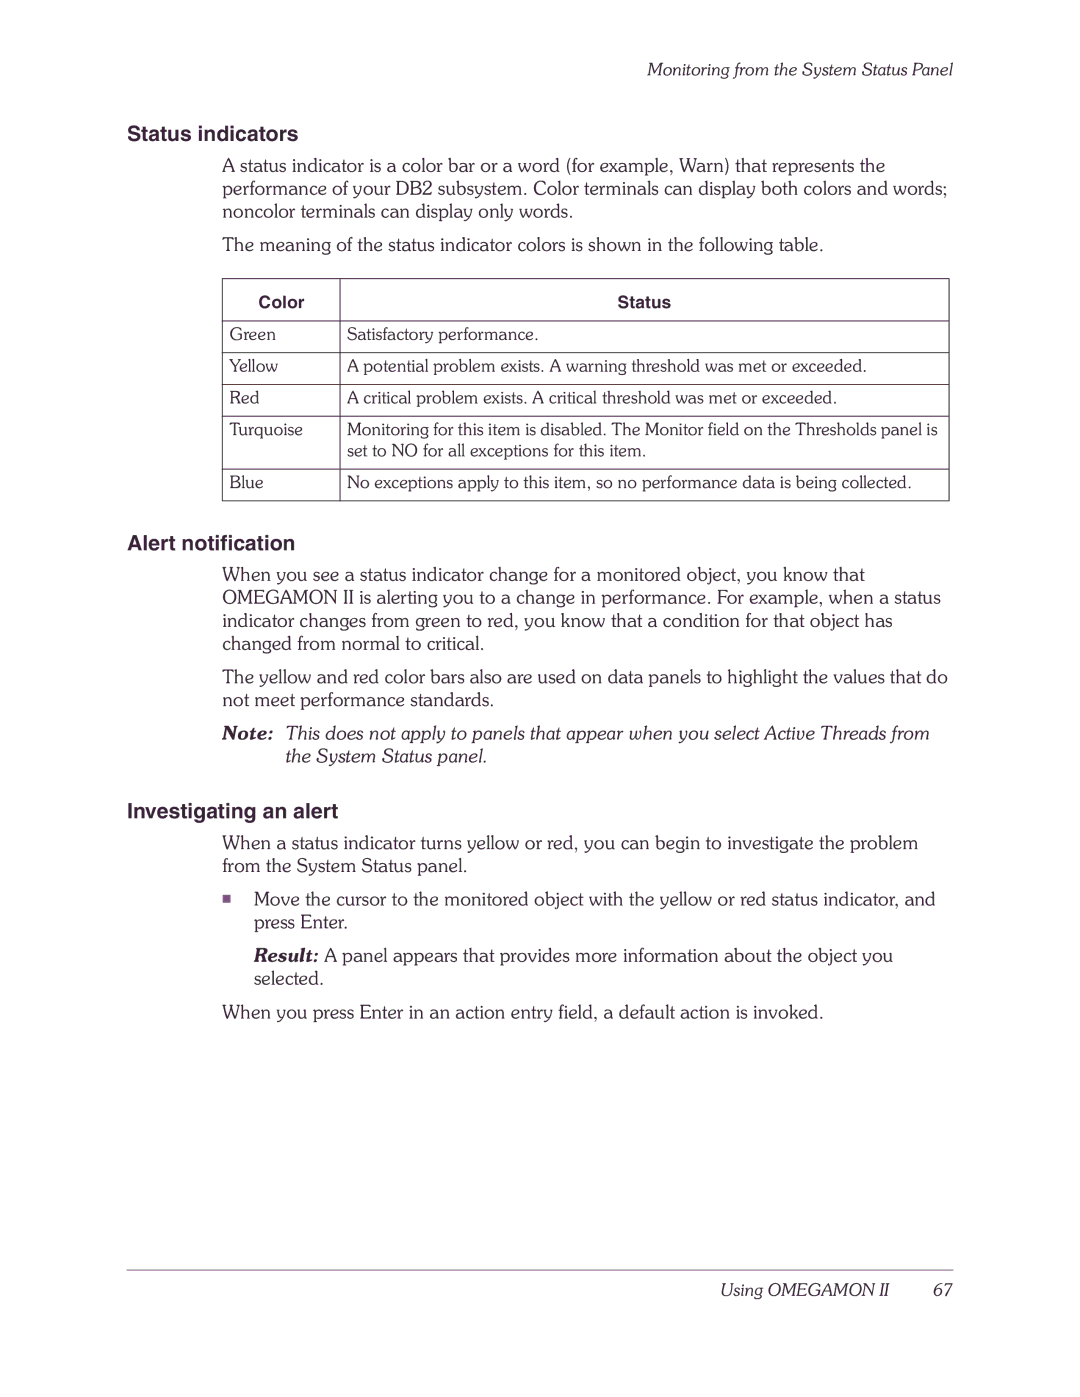
The meaning of the status indicator colors is shown in the following table.
Color | Status |
|
|
Green | Satisfactory performance. |
|
|
Yellow | A potential problem exists. A warning threshold was met or exceeded. |
|
|
Red | A critical problem exists. A critical threshold was met or exceeded. |
|
|
Turquoise | Monitoring for this item is disabled. The Monitor field on the Thresholds panel is |
| set to NO for all exceptions for this item. |
|
|
Blue | No exceptions apply to this item, so no performance data is being collected. |
|
|
Alert notification
When you see a status indicator change for a monitored object, you know that OMEGAMON II is alerting you to a change in performance. For example, when a status indicator changes from green to red, you know that a condition for that object has changed from normal to critical.
The yellow and red color bars also are used on data panels to highlight the values that do not meet performance standards.
Note: This does not apply to panels that appear when you select Active Threads from the System Status panel.
Investigating an alert
When a status indicator turns yellow or red, you can begin to investigate the problem from the System Status panel.
■Move the cursor to the monitored object with the yellow or red status indicator, and press Enter.
Result: A panel appears that provides more information about the object you selected.
When you press Enter in an action entry field, a default action is invoked.
Using OMEGAMON II | 67 |
