Investigating an Active Threads Alert
Investigating an Active Threads Alert
IntroductionThis is an example of how you might investigate a red light from the System Status panel. You can use this information to help you understand how to use the features of OMEGAMON to resolve other DB2 subsystem problems.
Active threads alert
In this example, the Active Threads alert on the System Status panel has turned red.
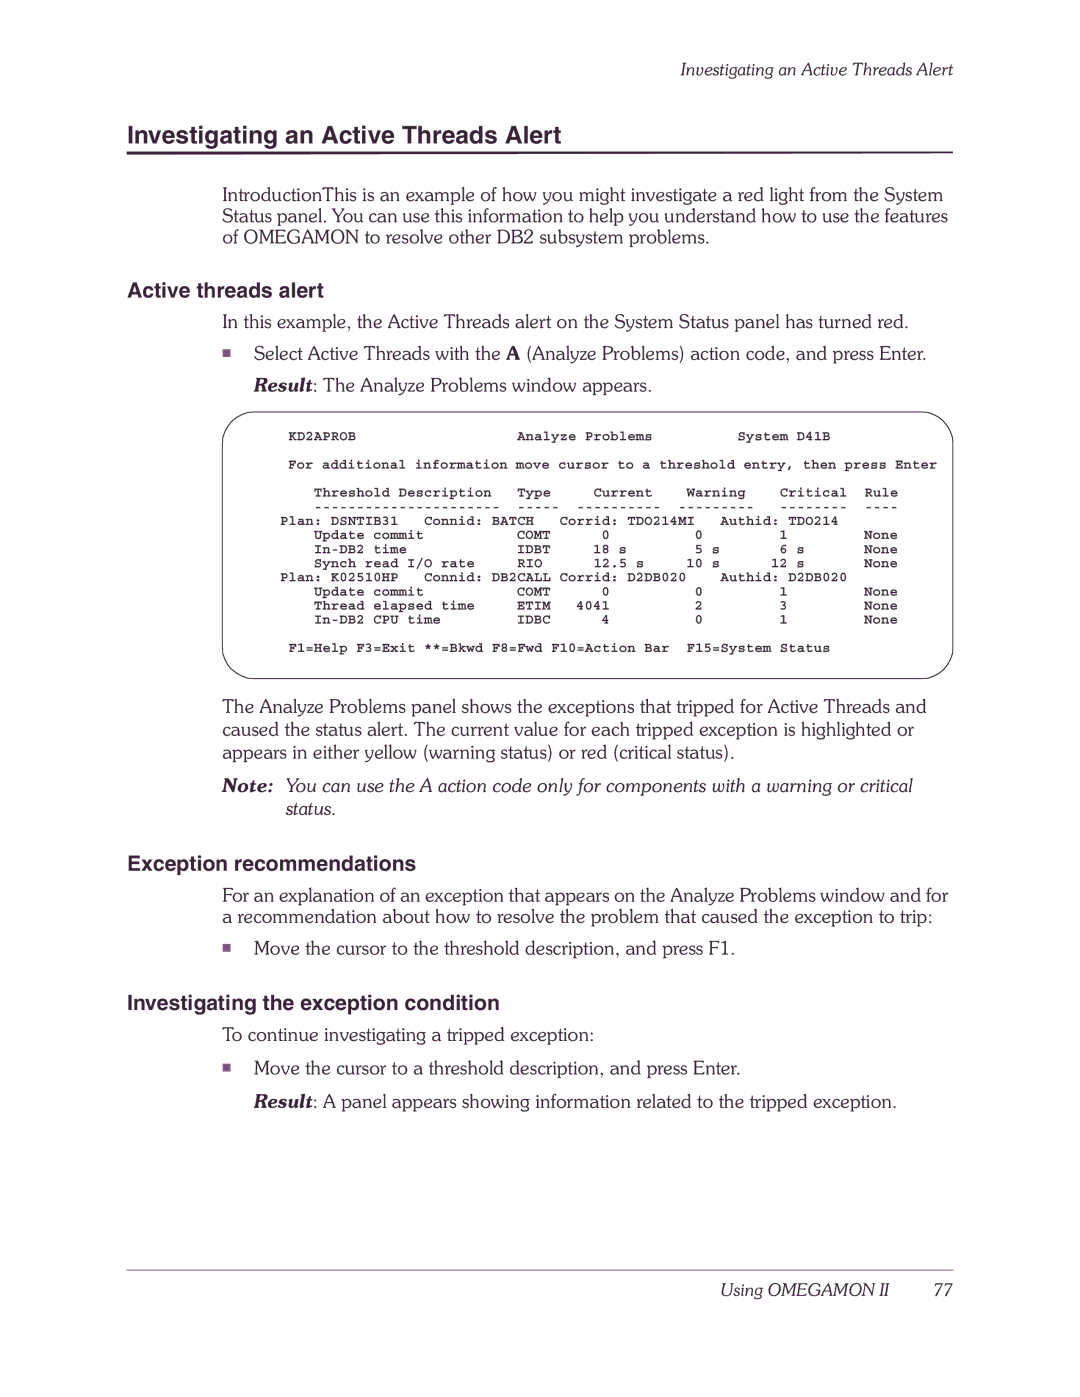
■Select Active Threads with the A (Analyze Problems) action code, and press Enter. Result: The Analyze Problems window appears.
KD2APROB | Analyze Problems | System D41B |
For additional information move cursor to a threshold entry, then press Enter
Threshold Description | Type | Current | Warning | Critical | Rule | |||||
Plan: DSNTIB31 | Connid: BATCH | Corrid: TDO214MI |
| Authid: TDO214 |
| |||||
Update commit | COMT | 0 |
| 0 |
|
| 1 |
| None | |
| IDBT | 18 | s | 5 | s |
| 6 | s | None | |
Synch read | I/O rate | RIO | 12.5 s | 10 | s |
| 12 | s | None | |
Plan: K02510HP | Connid: DB2CALL Corrid: D2DB020 |
| Authid: D2DB020 |
| ||||||
Update commit | COMT | 0 |
| 0 |
|
| 1 |
| None | |
Thread elapsed time | ETIM | 4041 |
| 2 |
|
| 3 |
| None | |
time | IDBC | 4 |
| 0 |
|
| 1 |
| None | |
F1=Help F3=Exit **=Bkwd F8=Fwd F10=Action Bar | F15=System Status |
| ||||||||
The Analyze Problems panel shows the exceptions that tripped for Active Threads and caused the status alert. The current value for each tripped exception is highlighted or appears in either yellow (warning status) or red (critical status).
Note: You can use the A action code only for components with a warning or critical status.
Exception recommendations
For an explanation of an exception that appears on the Analyze Problems window and for a recommendation about how to resolve the problem that caused the exception to trip:
■Move the cursor to the threshold description, and press F1.
Investigating the exception condition
To continue investigating a tripped exception:
■Move the cursor to a threshold description, and press Enter.
Result: A panel appears showing information related to the tripped exception.
Using OMEGAMON II | 77 |
