Using the Callable Interface
Step | Action |
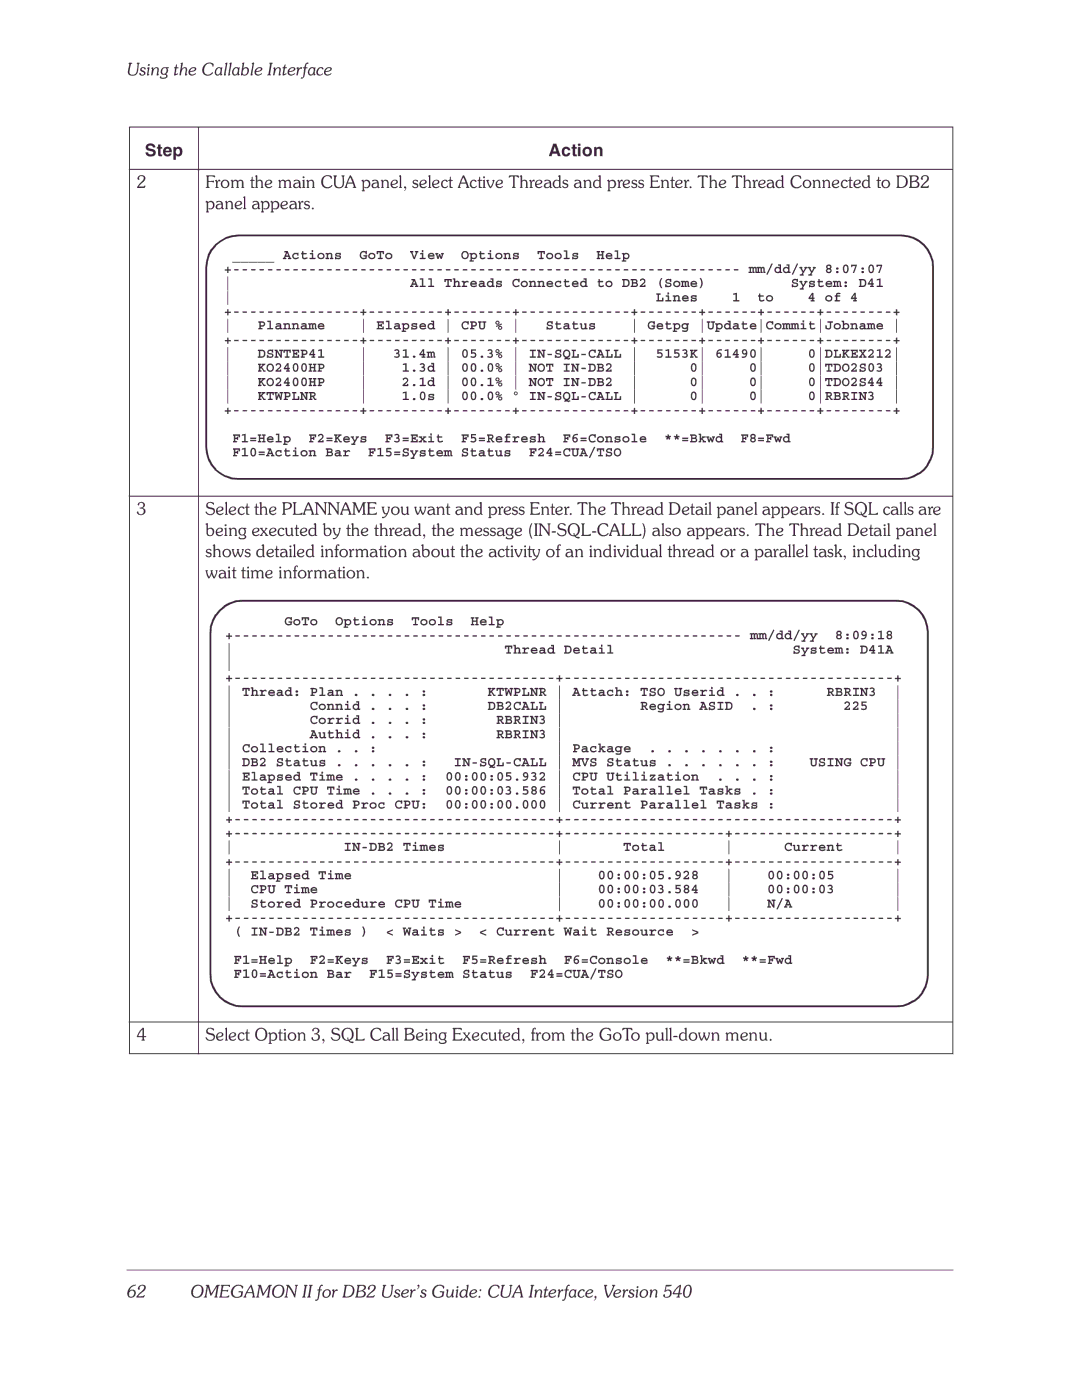
2From the main CUA panel, select Active Threads and press Enter. The Thread Connected to DB2 panel appears.
+ | GoTo View |
| Options | Tools Help |
|
| mm/dd/yy 8:07:07 |
| ||||
|
|
|
|
|
|
|
|
|
| |||
|
| All | Threads | Connected to DB2 (Some) |
| System: D41 |
| |||||
|
|
|
|
|
|
|
| Lines | 1 to | 4 of 4 |
| |
+ | + | + | + | + | ||||||||
Planname | Elapsed | CPU % | Status | Getpg UpdateCommitJobname | ||||||||
+ | + | + | + | + | ||||||||
DSNTEP41 | 31.4m | 05.3% | 5153K 61490 | 0DLKEX212 | ||||||||
KO2400HP | 1.3d | 00.0% | NOT | 0 | 0 | 0TDO2S03 | ||||||
KO2400HP | 2.1d | 00.1% | NOT | 0 | 0 | 0TDO2S44 | ||||||
KTWPLNR | 1.0s | 00.0% | º |
| 0 | 0 | 0RBRIN3 | |||||
+ | + | + | + | + | ||||||||
| F1=Help F2=Keys | F3=Exit |
| F5=Refresh F6=Console | **=Bkwd | F8=Fwd |
|
| ||||
| F10=Action Bar |
| F15=System | Status |
| F24=CUA/TSO |
|
|
|
|
| |
3Select the PLANNAME you want and press Enter. The Thread Detail panel appears. If SQL calls are being executed by the thread, the message
+ | Help |
| mm/dd/yy 8:09:18 |
| |||||
|
|
|
|
|
| ||||
|
|
| Thread Detail |
|
| System: D41A |
| ||
|
|
|
|
|
|
|
|
| |
+ |
| + |
|
| + | ||||
Thread: Plan . | . . . : |
| KTWPLNR Attach: TSO Userid | . . | : | RBRIN3 | |||
Connid | . . . : |
| DB2CALL | Region ASID . | : | 225 | |||
Corrid | . . . : |
| RBRIN3 |
|
|
|
| ||
Authid | . . . : |
| RBRIN3 |
|
|
|
| ||
Collection . . | : |
| Package | . . | : |
| |||
DB2 Status . . | . . . : | . . | : | USING CPU | |||||
Elapsed Time . | . . . : | 00:00:05.932 CPU Utilization . . . | : |
| |||||
Total CPU Time | . . . : | 00:00:03.586 Total Parallel Tasks . | : |
| |||||
Total Stored Proc CPU: | 00:00:00.000 Current Parallel Tasks | : |
| ||||||
+ |
| + |
|
| + | ||||
+ |
| + |
| + | |||||
| Total | Current | |||||||
+ |
| + |
| + | |||||
Elapsed Time |
|
| 00:00:05.928 | 00:00:05 | |||||
CPU Time |
|
| 00:00:03.584 | 00:00:03 | |||||
Stored Procedure CPU Time | 00:00:00.000 | N/A |
| ||||||
+ |
| + |
| + | |||||
| ( | < Waits > | < Current Wait Resource > |
|
|
|
| ||
| F1=Help F2=Keys F3=Exit F5=Refresh F6=Console **=Bkwd **=Fwd |
|
| ||||||
| F10=Action Bar | F15=System Status F24=CUA/TSO |
|
|
|
| |||
4
Select Option 3, SQL Call Being Executed, from the GoTo