Viewing virus and intrusions status | System status |
|
|
2Select Sessions & Network.
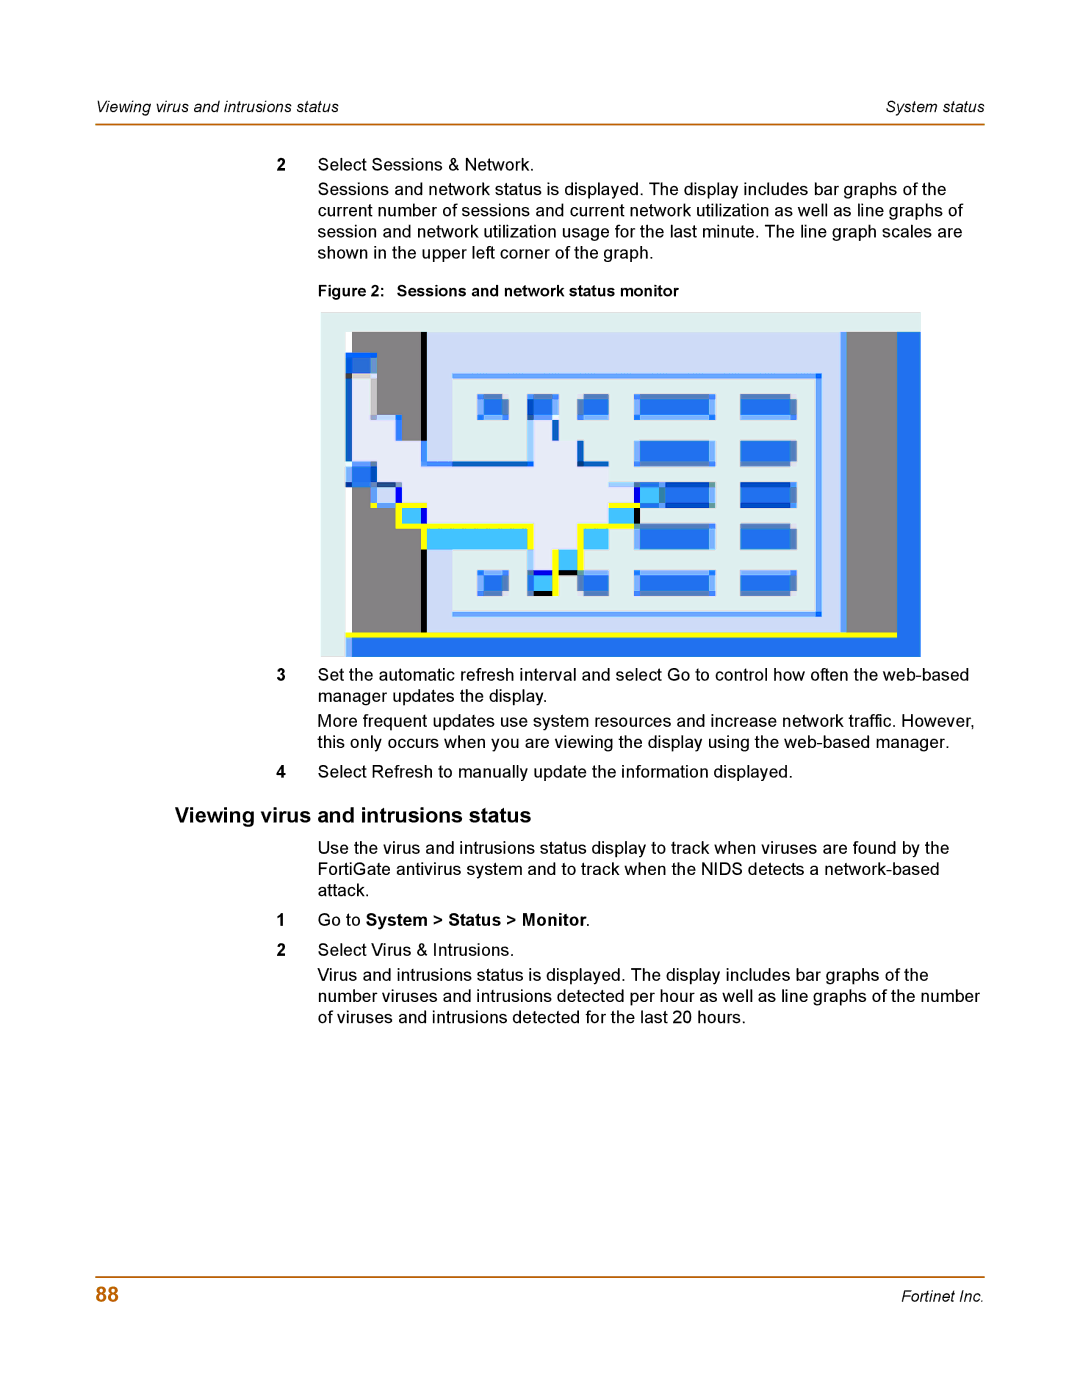
Sessions and network status is displayed. The display includes bar graphs of the current number of sessions and current network utilization as well as line graphs of session and network utilization usage for the last minute. The line graph scales are shown in the upper left corner of the graph.
Figure 2: Sessions and network status monitor
3Set the automatic refresh interval and select Go to control how often the
More frequent updates use system resources and increase network traffic. However, this only occurs when you are viewing the display using the
4Select Refresh to manually update the information displayed.
Viewing virus and intrusions status
Use the virus and intrusions status display to track when viruses are found by the FortiGate antivirus system and to track when the NIDS detects a
1Go to System > Status > Monitor.
2Select Virus & Intrusions.
Virus and intrusions status is displayed. The display includes bar graphs of the number viruses and intrusions detected per hour as well as line graphs of the number of viruses and intrusions detected for the last 20 hours.
88 | Fortinet Inc. |