Release Notes Version M.10.72 Software
For the HP ProCurve Series 3400cl Switches
Publication Number
Contents
Known Issues
Page
Release M.10.26
Software Fixes in Release M.08.51 M.10.72
Viii
Page
Page
Download Switch Documentation and Software from the Web
Software Updates
Downloading Software to the Switch
View or Download the Software Manual Set
T e
Downloading Software to the Switch
Xmodem Download From a PC or Unix Workstation
Tftp Download from a Server
Syntax copy xmodem flash primary secondary
ProCurve config# console baud-rate
Do you want to save current configuration y/n ?
Saving Configurations While Using the CLI
Boot Rom Version Current Boot Primary
Install Recommendations for I.08.12 Boot ROM Update
Software ProCurve Networking Products Letter
ProCurve Switch, Routing Switch, and Router Software Keys
Software Management
Minimum Software Versions for Series 3400cl Switch Features
For Switch 3400cl Hardware Accessories
OS/Web/Java Compatibility Table
Default Settings Affecting Security
Switch Management Access Security
Local Manager Password
Inbound Telnet Access and Web Browser Access
Secure File Transfers
Snmp-server mib hpswitchauthmib excluded
Snmp Access Simple Network Management Protocol
Physical Access to the Switch
Other Provisions for Management Access Security
Network Access Security
Access Control Lists ACLs
Web and MAC Authentication
Secure Shell SSH
Secure Socket Layer SSLv3/TLSv1
Traffic/Security Filters
802.1X Access Control
Key Management System KMS
Port Security, MAC Lockdown, MAC Lockout, and IP Lockdown
Identity-Driven Management IDM
Publication Updates
Operating Notes for Jumbo Traffic-Handling
Non-Genuine Mini-GBIC Detection and Protection Initiative
Igmp Command Update
Igmp Operating Notes
General Switch Traffic Security Guideline
Management Vlan IP Address
Interoperating with 802.1s Multiple Spanning-Tree
Rate-Limiting
Release M.10.17
Known Issues
Release M.08.70 through M.08.72 Enhancements
Release M.08.69 Enhancements
Release M.08.73 Enhancements
Release M.08.74 through M.08.77 Enhancements
ProCurveconfig# show fastboot Fast Boot Disabled
Using Fastboot To Reduce Boot Time
Release M.08.78 Enhancements
Release M.08.79 Enhancements
Operating Notes
Release M.08.80 through M.08.83 Enhancements
Release M.08.85 through M.08.88 Enhancements
Release M.08.84 Enhancements
Release M.08.89 Enhancements
DNS Resolver
Ping accounts015 traceroute sales021
Basic Operation
ProCurve# Ping leader
10.28.229.220 Alive, time =
10.22.240.73
ProCurve# traceroute Remote-01.common.group.net
Example Using DNS Names with Ping and Traceroute
Configuring a DNS Entry
Example Network Domain
10.28.192.2 10.28.229.219
Viewing the Current DNS Configuration
Arp Age Domain Suffix Pubs.outdoors.com
IP Config IP Address Subnet Mask
Server 10.28.229.10
Manual 10.28.192.1 255.255.255.0
Message Meaning
Event Log Messages
Security Notes
Changing and Viewing the Snmp Access Configuration
Snmp Communities
ProCurveconfig# Snmp-server mib hpswitchauthmib excluded
Releases M.08.90 and M.08.91 Enhancements
Mstp Default Path Cost Controls
Description
QoS Pass-Through Mode
Example Showing QoS Pass-Through Mode Set Using the CLI
Configuring QoS Pass-Through Mode
Displaying the Current QoS Pass-Through Mode on the Switch
Release M.08.94 Enhancements
Example
ProCurveconfig# dhcp-relay option 82 append mgmt-vlan
Dhcp Operation for the Topology in Figure
UDP Broadcast Forwarding
Releases M.08.95 through M.10.01 Enhancements
RADIUS-Assigned Access Control Lists ACLs
Release M.08.96 Enhancements
Releases M.08.97 through M.10.01 Enhancements
Release M.10.02 Enhancements
Operates on the 3400cl switches
Terminology
General Operation
T e s
Packet-filtering Process
Example of Sequential Comparison
Packet-Filtering Process in an ACL with N Entries ACEs
Example of How a RADIUS-Based ACL Filters Packets
Determining Traffic Policies
General Steps
Guidelines for Structuring a RADIUS-Based ACL
Planning the ACLs Needed To Enforce Traffic Policies
Operating Rules for RADIUS-Based ACLs
Limits Affecting RADIUS-Based ACL Applications
Limits for RADIUS-Based ACLs, Associated ACEs, and Counters
Limit Notes
Configuring an ACL in a Radius Server
Client 10.10.10.125 nastype = other secret =
END-VENDOR
Format Details for ACEs Configured in a RADIUS-Based ACL
Deny in udp from any to any 135, 137-139
Configuring the Switch To Support RADIUS-Based ACLs
MAC Authentication Option
Web Authentication Option
802.1X Option
Port port-#, No Radius ACLs applied on this port
Syntax show port-access authenticator port-list
Event Log Messages
ACE parsing error, tcp/udp ports
ACE parsing error, destination IP
Port port-# , No Radius ACLs applied on this port
Exceeded counter per port limit
Viewing SFlow Configuration
SFlow Show Commands
Viewing sFlow Agent Information
Instrumentation Monitor
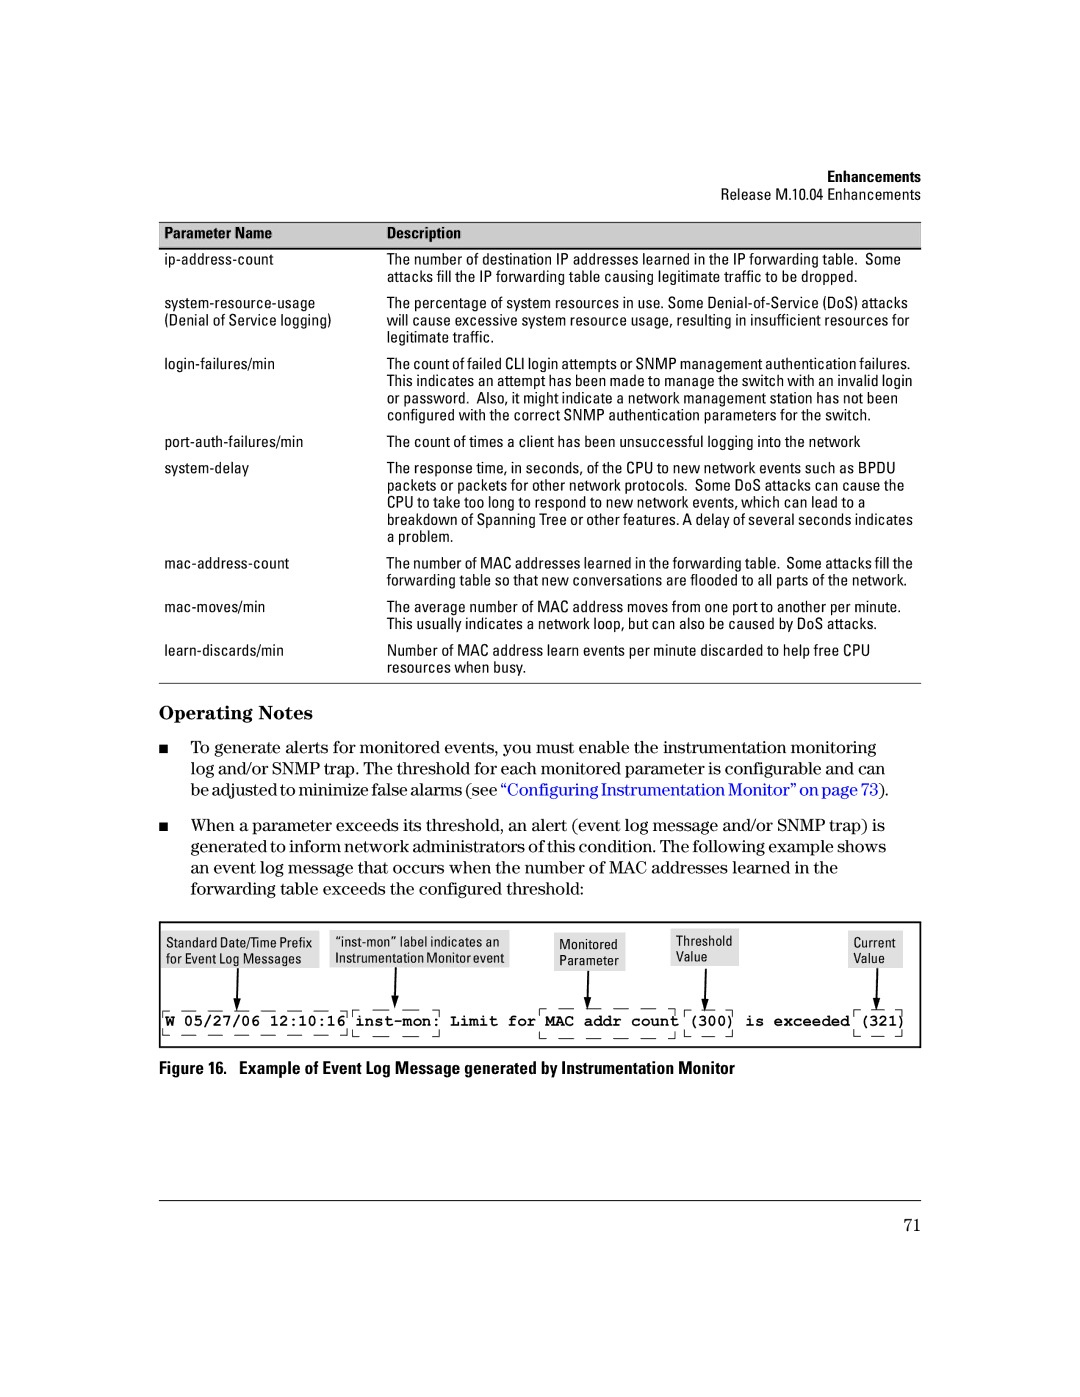
Release M.10.04 Enhancements
Ip-address-count
Known Limitations
Configuring Instrumentation Monitor
Examples
Viewing the Current Instrumentation Monitor Configuration
TCP/UDP Port Closure
ProCurve# show instrumentation Monitor configuration
Enabling/Disabling Tftp
Enabling/Disabling Snmp
Enabling/Disabling RIP
Enabling/Disabling Stacking
Spanning Tree Show Commands
BPDUs Tx BPDUs Rx 256654
Operating Notes
Release M.10.06 Enhancements
Release M.10.05 Enhancements
Release M.10.08 Enhancements
Release M.10.07 Enhancements
Release M.10.09 Enhancements
Uni-Directional Link Detection Udld
Udld Example
Configuring Udld
Configuration Considerations
ProCurveconfig#interface al-a4 link-keepalive
ProCurveconfig#interface al link-keepalive
ProCurveconfig# link-keepalive interval
ProCurveconfig# link-keepalive retries
Viewing Udld Information
Udld
ProCurve# clear link-keepalive statistics
CLI Command Example Warning Message Possible Problem
Configuration Warnings and Event Log Messages
ProCurveconfig# spanning-tree a9 bpdu-filter
Configuring STP Bpdu Filters
Release M.10.10 Enhancements
Spanning Tree Per-Port Bpdu Filtering
Viewing Status of Bpdu Filtering
Bpdu
Viewing Configuration of Bpdu Filtering
Release M.10.13 Enhancements
Releases M.10.11 through M.10.12 Enhancements
Releases M.10.14 through M.10.16 Enhancements
Release M.10.17 Enhancements
Release M.10.17 Enhancements
Terminology
ProCurveconfig# spanning-tree 1-10 bpdu protection
Configuring STP Bpdu Protection
Viewing Bpdu Protection Status
ProCurveconfig# loop-protect port-list
Configuring Loop Protection
Release M.10.21 Enhancements
Release M.10.22 Enhancements
Example of Show Loop Protect Display
Release M.10.24 Enhancements
Release M.10.23 Enhancements
Release M.10.25 Enhancements
Release M.10.26 Enhancements
Release M.10.27 Enhancements
Enhancements
Release M.10.29 Enhancements
Release M.10.28 Enhancements
Release M.10.30 Enhancements
Release M.10.31 Enhancements
Scheduled Reload
Release M.10.32 Enhancements
How RADIUS-Based Authentication Affects Vlan Operation
Release M.10.33 Enhancements
Vlan Assignment on a ProCurve Port
103
104
Example of an Active Vlan Configuration
106
107
Concurrent TACAS+ and Sftp
Release M.10.34 Enhancements
Release M.10.35 Enhancements
Dynamic ARP Protection
Introduction
Enabling Dynamic ARP Protection
ProCurveconfig# arp protect vlan
Configuring Trusted Ports for Dynamic ARP Protection
Configuring Trusted Ports
Adding an IP-to-MAC Binding to the Dhcp Database
ProCurveconfig# arp protect trust b1-b4, d1
ProCurveconfig# arp protect validate src-mac dst-mac
Configuring Additional Validation Checks on ARP Packets
Displaying ARP Packet Statistics
Verifying the Configuration of Dynamic ARP Protection
Release M.10.36 Enhancements
Release M.10.37 Enhancements
Monitoring Dynamic ARP Protection
Configuring Mstp Port Connectivity Parameters
117
Spanning-tree B2 priority
Release M.10.38 Enhancements
Send Snmp v2c Informs
Enabling and Configuring Snmp Informs
Community
Release M.10.39 Enhancements
Configuring Radius Authentication
Radius Server Unavailable
Overview
122
SSH
Specifying the MAC Address Format
Example of Setting the ARP Age Timeout to 1000 Minutes
ARP Age Timer Increase
125
IP Config
Release M.10.41 Enhancements
Release M.10.40 Enhancements
Release M.10.42 Enhancements
Release M.10.43 Enhancements
Protection Against IP Source Address Spoofing
Differences Between Switch Platforms
Filtering IP and MAC Addresses Per-Port and Per-VLAN
Prerequisite Dhcp Snooping
10.0.10.1 001122-110011
An Example of a Static Configuration Entry
Enabling Dynamic IP Lockdown
Adding an IP-to-MAC Binding to the Dhcp Binding Database
Potential Issues with Bindings
Adding a Static Binding
Verifying the Dynamic IP Lockdown Configuration
Displaying the Static Configuration of IP-to-MAC Bindings
Example of show ip source-lockdown status Command Output
Debugging Dynamic IP Lockdown
Example of show ip source-lockdown bindings Command Output
Release M.10.44 through M.10.64 Enhancements
Example of debug dynamic-ip-lockdown Command Output
Release M.10.65 Enhancements
Mstp Vlan Configuration Enhancement
PreConfiguring VLANs in an MST Instance
Enabling Mstp on the Switch
ProCurveconfig# spanning-tree protocol-version mstp
ProCurveconfig# write mem
ProCurveconfig# spanning-tree instance 1 vlan
Configuring Mstp Instances with the Vlan Range Option
Operating Notes
Release M.10.66 Enhancements
Configure Logging via Snmp
Adding a Priority Description
Adding a Description for a Syslog Server
Example of the Logging Command with a Priority Description
Lacp and Link Traps Global Disable
Release M.10.67 Enhancements
Release M.10.68 Enhancements
Release M.10.70 Enhancements
Release M.10.69 Enhancements
Release M.10.71 Enhancements
Release M.10.72 Enhancements
Release M.08.53 Never Released
Release M.08.52
Release M.08.54
Release M.08.55 Release M.08.60
Show CDP the Yes is changed to Yes,Receive Only
Problems Resolved in Release M.08.63 Not a general release
Problems Resolved in Release M.08.62
Release M.08.62
Release M.08.63
Release M.08.65
Release M.08.64
Release M.08.66
Release M.08.67
Problems Resolved in Release M.08.69
Problems Resolved in Release M.08.68 Not a general release
Release M.08.68
Release M.08.69
Duplicate access control entry
Problems Resolved in Release M.08.70 Not a general release
Problems Resolved in Release M.08.71 Never released
Release M.08.70
Release M.08.72
Release M.08.73
Release M.08.74
Release M.08.75
Release M.08.76
Release M.08.77
Release M.08.79
Release M.08.78
Release M.08.80
Release M.08.81
Release M.08.84
Release M.08.83
Release M.08.85
Release M.08.86
Problems Resolved in Release M.08.88 Not a general release
Problems Resolved in Release M.08.87 Not a general release
Release M.08.87
Release M.08.88
Problems Resolved in Release M.08.92 Not a general release
Problems Resolved in Release M.08.90 Not a general release
Release M.08.90
Release M.08.91
Release M.08.94
Release M.08.93
Release M.08.95
Release M.08.96
Release M.10.01
Release M.08.97
Release M.10.02
Release M.10.03
Release M.10.04
Release M.10.05
Release M.10.06
Problems Resolved in Release M.10.08
Problems Resolved in Release M.10.07
Release M.10.07
Release M.10.08
Problems Resolved in Release M.10.10
Problems Resolved in Release M.10.09
Release M.10.09
Release M.10.10
Release M.10.11
Release M.10.12
Release M.10.13
Release M.10.14
Release M.10.15
Release M.10.16
Problems Resolved in Release M.10.20
Problems Resolved in Release M.10.17
Release M.10.17
Release M.10.18 Release M.10.19
Problems Resolved in Release M.10.22 Not a general release
Problems Resolved in Release M.10.21 Not a general release
Release M.10.21
Release M.10.22
Problems Resolved in Release M.10.24 Never released
Problems Resolved in Release M.10.23 Never released
Release M.10.23
Release M.10.24
Problems Resolved in Release M.10.27 Never released
Problems Resolved in Release M.10.26 Not a general release
Release M.10.26
Release M.10.27
Problems Resolved in Release M.10.29 Never released
Problems Resolved in Release M.10.28 Not a general release
CCCCCline 10007 Error setting configuration
Release M.10.28
Problems Resolved in Release M.10.30
Transceiver hotswap PR1000390888 Transceiver hotswap issues
Problems Resolved in Release M.10.31
Release M.10.30
Problems Resolved in Release M.10.33
Problems Resolved in Release M.10.32
Release M.10.32
Release M.10.33
Problems Resolved in Release M.10.35
Problems Resolved in Release M.10.34
Release M.10.34
Release M.10.35
Release M.10.36
Release M.10.37
Release M.10.38
Release M.10.39
Release M.10.40
Release M.10.41
Release M.10.42
Release M.10.43
Release M.10.44
Release M.10.45
Release M.10.46
Release M.10.47
Problems Resolved in Release M.10.48 Not a Public Release
Fatal error Server unexpectedly closed connection
Problems Resolved in Release M.10.49 Not a Public Release
Release M.10.48
Problems Resolved in Release M.10.50 M.10.64 Never Built
Software exception at ConfigTree.cc508 -- in mChassCtrl
Problems Resolved in Release M.10.65 Not a Public Release
Release M.10.50 through M.10.64
Problems Resolved in Release M.10.66 Not a Public Release
Release M.10.66
Software exception at dsnoopctrl.c109 -- in mDsnoop002
Release M.10.67
Problems Resolved in Release M.10.67 Never Released
Problems Resolved in Release M.10.69 Not a Public Release
Problems Resolved in Release M.10.68
Release M.10.68
Release M.10.69
Release M.10.70
Problems Resolved in Release M.10.70 Not a Public Release
Software exception at ldbalutil.c2525 -- in mLdBalCtrl
Software exception at aaa8021xproto.c255 -- in m8021xCtrl
Problems Resolved in Release M.10.72
Problems Resolved in Release M.10.71 Not a Public Release
Release M.10.71
Release M.10.72
184
185
Message
October