MAY
Block Diagram
General Description
National Semiconductor Corporation
Table of Contents
Features
Device Overview
Quad Uart
Bluetooth LLC
Can Interface
Advanced Audio Interface
MULTI-FUNCTION Timer
MICROWIRE/SPI
ACCESS.BUS Interface
Versatile Timer Unit
Serial Debug Interface
Power Management
DMA Controller
Development Support
LQFP-128
Signal Descriptions
CP3BT26
LQFP-144
Bbclk
Reset
X1CKI
X1CKO
Name Pins Primary Function Alternate Alternate Function
PG5
PG4
Sdat
PG6
X1CKI
WR1
Selio
WR0
CTS PE4
SLE
GENERAL-PURPOSE Registers
CPU Architecture
Dedicated Address Registers
12 11 Reserved
Processor Status Register PSR
Interrupt Base Register Intbase
No carry or borrow occurred Carry or borrow occurred
Mode for the CR16B large model.
Configuration Register CFG
When the IDT has 16-bit entries, and all ex
Is held in the Intbase register, which is not
Addb R1, R2
Addressing Modes
Loadw 12R5, R6
Stacks
Instruction SET
Instruction Set Summary Mnemonic Operands Description
Tbit
Ashud
Lshd
LPR
POP
Retx
Push
Popret
NOP
Stormp
Eiwait
Wait
Operating Environment
Memory
IN/A
BIU Control Registers
BUS Interface Unit BIU
BUS Cycles
Empty
2 I/O Zone Configuration Register Iocfg
Static Zone 0 Configuration Register SZCFG0
Static Zone 2 Configuration Register SZCFG2
Static Zone 1 Configuration Register SZCFG1
WBR RBE Hold Wait Ipst
Flash Program/Data Memory
Access to Peripherals
Wait and Hold States
RAM Memory
Module Configuration Register Mcfg
System Configuration Registers
System Configuration Registers Name Address Description
Software Reset Register Swreset
Module Status Register Mstat
Flash Memory Protection
Flash Memory
Flash Memory Organization
Flash Memory Operations
Information Block Module Erase
Main Block Page Erase
Main Block Module Erase
Main Block Write
Information Block Words
Boot
Area
Flash Memory Interface Registers
CPU Reset Behavior
Boot Area Start-Up Operation
Empty Ispe
Flash Memory Information Block Data Register
Flash Memory 0 Write Enable Register FM0WER/FSM0WER
Flash Memory 1 Write Enable Register FM1WER
FMIBDR/FSMIBDR
Flash Memory Control Register Fmctrl
Flash Data Memory 0 Write Enable Register FSM0WER
Fsmctrl
Fsmpsr
Fsmstat
FMSTART/FSMSTART
Flash Memory End Time Reload Register FMEND/FSMEND
Flash Memory Auto-Read Register 0 FMAR0/ FSMAR0
FMRCV/FSMRCV FSMAR1
Flash Memory Auto-Read Register 2 FMAR2/ FSMAR2
Transfer Types
DMA Controller
Channel Assignment
DMA Channel Assignment Peripheral Trans Register Action
Operation Modes
Software DMA Request
Debug Mode
DMA Controller Register SET
Device B Address Counter Register ADCBn
Device a Address Counter Register ADCAn
Device a Address Register ADRAn
Device B Address Register ADRBn
Block Length Register BLTRn
DMA Control Register DMACNTLn
VLD Chac OVR
DMA Status Register Dmastat
VLD
Maskable Interrupts
Interrupts
NON-MASKABLE Interrupts
Interrupt Controller Registers
External NMI Trap Control and Status Register Exnmi
Interrupt Vector Register Ivct
Non-Maskable Interrupt Status Register Nmistat
Interrupt Status Register 1 ISTAT1
Interrupt Enable and Mask Register 1 IENAM1
Interrupt Enable and Mask Register 2 IENAM2
Interrupt Status Register 2 ISTAT2
Maskable Interrupts Assignment IRQ Number Description
Maskable Interrupt Sources
Nested Interrupts
IRQ Number Description
Triple Clock and Reset
Triple Clock and Reset Module
Type
External Crystal Network
Crystal Resonance Frequency
Capacitor C1, C2 Capacitance
PLL Clock
Main Clock
Slow Clock
Min. Q factor
Clock and Reset Registers
POWER-ON Reset
External Reset
System Clock
MODE20
Power Save Mode
Power Management
Active Mode
Module Activity Summary Power Mode Clock
Power Management Registers Name Address Description
Idle Mode Power Management Registers
Halt Mode
Power Management Control Register Pmmcr
Hccm
DHC
Hcch
OHC OMC OLC
Active Mode to Power Save Mode
OHC
Software-Controlled Transition to Active Mode
Entering Idle Mode
Entering Halt Mode
Wake-Up Transition to Active Mode
Multi-Input Wake-Up Module Block Diagram
Multi-Input Wake-Up
Miwu Channel
MULTI-INPUT WAKE-UP Registers
Miwu Sources
Multi-Input Wake-Up Registers Name Address Description
Wake-Up Enable Register WK0ENA
Wake-Up Interrupt Enable Register WK0IENA
Wake-Up 1 Interrupt Enable Register WK1IENA
Wake-Up 1 Edge Detection Register WK1EDG
Wake-Up 1 Interrupt Control Register
Wake-Up Interrupt Control Register
WK0ICTL1 WK0ICTL2
WK1ICTL1 WK1ICTL2
Wake-Up 1 Pending Register WK1PND
Wake-Up Pending Register WK0PND
Wake-Up Pending Clear Register WK0PCL
Wake-Up 1 Pending Clear Register WK1PCL
Programming Procedures
Input/Output Ports
Port Registers
Port Registers
Address Description
Port Data Output Register PxDOUT
Port Alternate Function Register PxALT
Port Data Input Register PxDIN
Port Direction Register PxDIR
Alternate Function Select
Port High Drive Strength Register PxHDRV
Port Alternate Function Select Register PxALTS
Port Pin PxALTS =
OPEN-DRAIN Operation
X1CKI/BBCLK
Bluetooth Controller
RF Interface
Rfdata
Sclk
Serial Interface
Rfce
Sdat
Write Operation
Serial Interface Write Timing Read Operation
Bit, and register address for a read cycle. In the second
First part of read cycle driven by CP3BT26. Address is 0Ah
15.3 LMX5251 POWER-UP Sequence
15.4 LMX5252 POWER-UP Sequence
Bluetooth Global Registers
Bluetooth Sleep Mode
Bluetooth Sequencer RAM
Bluetooth Shared Data RAM
Functional Description
16.0 12-Bit Analog to Digital Converter
Data Path
ADC Voltage References
Operation
ADC Clock Generation
Pen-Down Detector
Touchscreen Driver Configuration
Touchscreen Interface
RY2
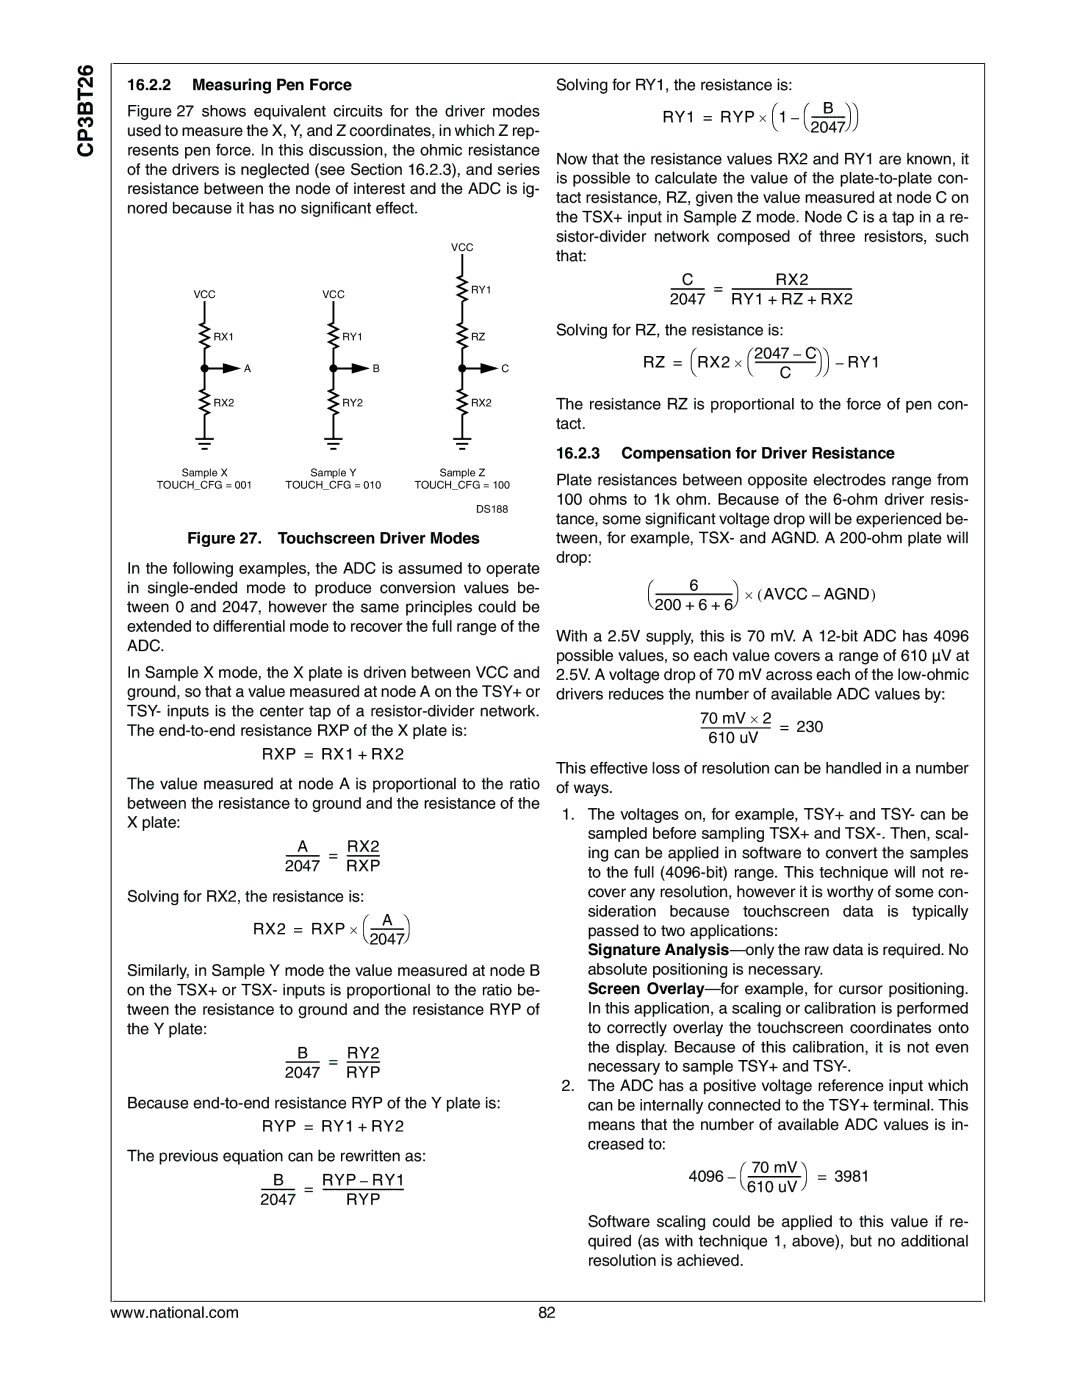
Measuring Pen Force
RX2
RYP
ADC Register SET
ADC Operation in POWER-SAVING Modes
Freeze
ADC Registers Name Address Description
Muxcfg
Touchcfg ADC0/TSX+ ADC1/TSY+ ADC2/TSX ADC3/TSY
Nrefcfg
Prefcfg
Clkdiv
ADC Conversion Control Register Adccntrl
ADC Start Conversion Delay Register Adcscdly
ADC Start Conversion Register Adcstart
Adcoflw
ADC Result Register Adcreslt
Adcresult
Sign
RNG Module Block Diagram
Random Number Generator RNG
Random Number Generator Register SET
USB Controller
Functional States
Endpoint Operation
TX Fifo RX Fifo
Bidirectional Control Endpoint FIFO0 Operation
Transmit Endpoint Fifo Operation TXFIFO1, TXFIFO2, TXFIFO3
Receive Endpoint Fifo Operation RXFIFO1, RXFIFO2, RXFIFO3
USB Controller Registers
USB Controller Registers Name Address Description
Main Control Register Mcntrl
USB Functional States
Node Functional State Register Nfsr
NFS
NFS
Main Mask Register Mamsk
Main Event Register Maev
Alternate Event Register Altev
Transmit Event Register Txev
Alternate Mask Register Altmsk
Transmit Mask Register Txmsk
Receive Mask Register Rxmsk
Receive Event Register Rxev NAK Event Register Nakev
NAK Mask Register Nakmsk
Frame Number High Byte Register FNH
Fifo Warning Event Register Fwev
Fifo Warning Mask Register Fwmsk
Dsrc
DMA Event Register Dmaev
Mirror Register MIR
DMA Error Register Dmaerr
DMA Mask Register Dmamsk
DMA Count Register Dmacnt
Endpoint Control 0 Register EPC0
Transmit Command 0 Register TXC0
Transmit Status 0 Register TXS0
Transmit Data 0 Register TXD0
Receive Command 0 Register RXC0
Receive Status 0 Register RXS0
Endpoint Control Register n EPCn
Receive Data 0 Register RXD0
Transmit Status Register n TXSn
Last
Transmit Command Register n TXCn
Tfwl
RFF
Tfwl
Transmit Fifo Warning Limit
Receive Status Register n RXSn
Bytes Remaining in Fifo
Receive Fifo Warning Limit
Receive Command Register n RXCn Receive Data Register n RXD
Transceiver Interface
Rfwl
Can Module
Can Block Diagram
Basic can Concepts
Start of Frame SOF
Can Frame Types
Can Frame Fields
Arbitration Field
Cyclic Redundancy Check CRC
Data Length Code DLC
Data Field
ACK Field
Data Field
Remote Frame
Cyclic Redundancy Check Field CRC
Error Frame
Error Frame Overload Frame
Bit CRC Error
Stuff Error
Form Error
Acknowledgment Error
Error Passive
Error Active
Error Warning
Error Counters
Synchronization
Bit Time Logic
Can Bit Time
Bit Timing
Message Transfer
CKI
Two 32-bit masks are used to filter unwanted messages
Acceptance Filtering
Example 1 Acceptance of a Single Identifier
From the can bus Gmask and BMASK. shows
Receive Structure
120
Writing to Buffer Status Code During
Receive Procedure
Receive Timing
Rxbusy
Buffer Read Routine Bufflock Enabled
122
Transmit Scheduling
Transmit Structure
Transmit Priority
Txpri
PRI
Interrupts
TX Buffer States
Time Stamp Counter
IRQ IST3 IST2 IST1 IST0
Message Buffer Organization
CPU Access to can Registers/Memory
Memory Organization
Message Buffer Map Address Register
Can Controller Registers Name Address Description
Can Controller Registers
Buffer Status/Control Register Cnstat
ST3 DIR ST2 ST1 ST0 Busy
Buffer Status Section of the Cnstat Register
Buffer Status
Storage of Standard Messages
Data Length Coding
DLC
Standard Frame with 8 Data Bytes Address Buffer Register
Cnstat DLC
Extended Messages with 8 Data Bytes Address Buffer Register
PRI SRR
Storage of Remote Messages
Frame is received, the contents of these registers will be
Contents of these registers are ignored. If a remote
Extended Remote Frame Address Buffer Register
Can Global Configuration Register Cgcr
When the Loopback bit is set, all messages
Listen Only bit can be used to configure
When the Ignore Acknowledge bit is set,
Dress, as shown in Figure
SJW
RTR IDE
TSEG1
TSEG2
Xrtr
Basic Mask BM2818
Can Interrupt Enable Register Cien
Basic Mask Register BMSKB/BMSKX
BM170
IRQ
Error Field Identifier
Can Error Counter Register Canec
Can Error Diagnostic Register Cediag
EFID30
System START-UP and MULTI-INPUT WAKE-UP
Can Timer Register Ctmr
External can Pins Signal Name Type Description
External Connection
Acceptance Filter Considerations
Minimum Clock Frequency Requirements Baud Rate
Bit Time Logic Calculation Examples
Remote Frames
Usage Hint
Advanced Audio Interface
Audio Interface Signals
Audio Interface Modes
Normal Mode
Synchronous Mode
DMA Support
145
BIT Clock Generation
Clock Configuration
Frame Clock Generation
Audio Interface Operation
Fifo Operation
Transmit
DMA Operation
Receive
Communication Options
Frame Sync Signal
Data Word Length
Audio Control Data
Short and Long Frame Sync Pulses
Loopback Mode
IOM-2 Mode
150
Audio Interface Registers
Freeze Mode
Audio Interface Registers Name Address Description
Audio Receive DMA Register n ARDRn
Audio Receive Fifo Register Arfr
Audio Transmit Fifo Register Atfr
Audio Transmit DMA Register n ATDRn
SCS
Audio Global Configuration Register Agcr
Slots per Mode Frame
FSL
Txeic Txic Rxeic Rxic Rxie
Audio Interrupt Status and Control Register Aiscr
Txeip Txip Rxeip Rxip Txeie Txie Rxeie Rxie
Txeip
Rxdsa Bit Slots Enabled For DMA
Rxsa Bit Slots Enabled
Audio Receive Status and Control Register Arscr
Txdsa Bit Slots Enabled For DMA
Txsa Bit Slots Enabled
Audio Transmit Status and Control Register Atscr
RMD
Audio Clock Control Register Accr
Audio DMA Control Register Admacr
DMA Request Condition
Operation
CVSD/PCM Conversion Module
PCM Conversions
Cvsd to PCM Conversion
Cvsd Conversion
PCM to Cvsd Conversion
Interrupt Generation
CVSD/PCM Converter Registers
Linearout
Cvsd Status Register Cvstat
Functional Overview
Uart Modules
Uart Operation
Uart Block Diagram
Uart Asynchronous Communication
Diagnostic Mode
Frame Format Selection
Prescaler Factors
Prescaler Factor
Break Generation and Detection
Parity Generation and Detection
Uart Registers
Uart Registers Name Address Description
Uart Transmit Data Buffer UnTBUF
Uart Baud Rate Divisor UnBAUD
Uart Receive Data Buffer UnRBUF
Uart Frame Select Register UnFRS
Uart Mode Select Register 1 UnMDSL1
Uart Status Register UnSTAT
UOVSR30
Uart Interrupt Control Register UnICTRL
Uart Oversample Rate Register UnOVR
Oversampling Rate
Uart Sample Position Register UnSPOS
Uart Mode Select Register 2 UnMDSL2
Baud Rate Calculations
Oversampling Rate Sample Position
173
174
Microwire Interface
Microwire/SPI Interface
Microwire Operation
Shifting
Writing
Clocking Modes
Master Mode
Normal Mode Scidl =
Microwire Interrupt Trigger Condition Status Enable Bit
Slave Mode
MWCTRL1
Microwire Interface Registers
Mwen
Scdv
Microwire Status Register Mwstat
SCM
OVR RBF BSY
Data Transactions
ACCESS.bus Interface
ACB Protocol Overview
Start and Stop
Addressing Transfer Formats
Acknowledge Cycle
Arbitration on the Bus
ACB Functional Description
Slave Mode
Master Error Detections
Bus Idle Error Recovery
Slave Error Detections
ACCESS.BUS Interface Registers
ACB Control Status Register Acbcst
Start
Tgscl
ACB Control Register 1 ACBCTL1
Stop
ACB Control Register 2 ACBCTL2
ACB Control Register 3 ACBCTL3
Saen Addr
Usage Hints
ACB Own Address Register 1 ACBADDR1
Saen
Avoiding Bus Error During Write Transaction
190
191
Timing and Watchdog Module
Timer T0 Operation
TWM Structure
TWM Registers
Power Save Mode Operation
Watchdog Operation
Register Locking
Mdiv
T0IN
TWMT0 Control and Status Register T0CSR
Watchdog Programming Procedure
Watchdog Service Data Match Register Wdsdm
Watchdog Count Register Wdcnt
Clock Source Block
Multi-Function Timer
Timer Structure
196
Limitations in Low-Power Modes
Timer Operating Modes
Pulse Accumulate Mode
Counter Clock Source Select
Mode 1 Processor-Independent PWM
198
Mode 2 Dual Input Capture
Dual-Input Capture Mode
Mode 3 Dual Independent Timer/Counter
200
Mode 4 Input Capture Plus Timer
Input Capture Plus Timer Mode
Taen
Timer Interrupts
Timer I/O Functions
Tben
Timer Registers
Reload/Capture a Register Tcra
Timer Mode Control Register Tctrl
Reload/Capture B Register Tcrb
Timer Interrupt Control Register Tictl
Timer Interrupt Clear Register Ticlr
VTU Functional Description
Versatile Timer Unit VTU
206
Dual 8-bit PWM Mode
VTU PWM Generation
VTU 16-bit PWM Mode Dual 16-Bit Capture Mode
208
VTU Dual 16-bit Capture Mode Low Power Mode
ISE Mode operation
VTU Registers
Mode Control Register Mode
VTU Registers Name Address Description
CxEDG Capture Counter Reset
Interrupt Control Register Intctl
Interrupt Pending Register Intpnd
Clock Prescaler Register 1 CLK1PS
Clock Prescaler Register 2 CLK2PS
Duty Cycle/Capture Register n DTYCAPx
Counter Register n COUNTx
CNTx
Period/Capture Register n PERCAPx
Bluetooth LLC Registers
Register Map
Register Name Size Address Access Value After Comments Type
USB Node Registers
EPC2
EPC1
TXC1
EPC4
Can Module Message Buffers
Can Registers
DMA Controller
Bus Interface Unit
Flash Program Memory Interface
System Configuration
Flash Data Memory Interface
Triple Clock + Reset
CVSD/PCM Converter
Multi-Input Wake-Up
General-Purpose I/O Ports
Register Name Size Address
Comments Type
Advanced Audio Interface
Interrupt Control Unit
UART0
UART1
UART2
UART3
Multi-Function Timer
ACCESS.bus
Timing and Watchdog
Versatile Timer Unit
ADC
Rngd
RNG
Rngcst
Word FF F284h
Register Bit Fields
USB
Nakev OUT Nakmsk Fwev RXWARN31
Setup Toggle Rxlast Rcount RXC0
IGN Ignout Rxen Setup EPC1
Fwmsk RXWARN31
Can
Control Status
Memory Registers
Dmac
TBI Register
System Configuration Registers
BIU
Flash
Flash Data Memory
CVSD/PCM
CLK3RES
Gpio Registers
PMM Register
MIWU16
AAI
ICU Registers
Uart
ACB Registers
MWSPI16
MFT16
VTU
Rngd
Rngcst
Imsk
Rngdivh
Absolute Maximum Ratings
Electrical Characteristics
Symbol Parameter Conditions Min Max Units
TBD
IOOff
LSB
Symbol Parameter Conditions Min Typ Max Units
INL
DNL
Flash Memory ON-CHIP Programming
Reset and NMI Input Signals
Output Signal Levels
Clock and Reset Timing
TRI-STATE
NMI Signal Timing
Clock Timing
Uart Output Signals
Uart Timing
Port Output Signals
30.9 I/O Port Timing
AAI Output Signals
Advanced Audio Interface AAI Timing
Transmit Timing, Short Frame Sync
Receive Timing, Long Frame Sync
Microwire/SPI Input Signals
MICROWIRE/SPI Timing
Microwire/SPI Signals Symbol Description Reference Min ns
Microwire/SPI Output Signals
Alternate Mode After RE On MSK Propagation Time
Normal Mode After FE on
Microwire Data Out Valid
254
255
Microwire Transaction Timing, Alternate Mode, Scidl =
256
257
ACCESS.BUS Timing
ACCESS.bus Output Signals
259
ACB Data Timing
260
USB Port AC Characteristics
MULTI-FUNCTION Timer MFT Timing
TIOx Input Low Time RE on CLK
Versatile Timing Unit VTU Timing
TIOx Input High Time Rising Edge RE on CLK
262
External Bus Output Signals
External BUS Timing
Early Write Between Normal Read Cycles No Wait States
264
265
Consecutive Normal Read Cycles Burst, No Wait States
266
267
Early Write Between Fast Read Cycles
268
PWR
Pin Assignments
LQFP-128 Package
X1CKO X1CKI
X2CKI X2CKO ENV2
Reset TMS
Avcc PWR Adgnd Advcc Uvcc
SDA ADC0 TSX+
PF0 MSK/TIO1
PE0 RXD0 Gpio PE1 TXD0 PE2 RTS PE3 CTS PE4 CKX/TB PE5
SRFS/NMI
PF1 MDIDO/TIO2
LQFP-144 Package
272
ADC5 MUXOUT1
SCL SDA ADC0 TSX+
ADC4 MUXOUT0
ADC7 Adcin
Pin Name Alternate Functions Pin Number Type
A11
A22 A21 A20 A19 A18 A17 A16 A15 A14 A13
A12
A10
Revision History
Revision History
Date Major Changes From Previous Version
Physical Dimensions millimeters unless otherwise noted
LQFP-128 Package LQFP-144 Package
Life Support Policy
Form when properly used in accordance with instructions
Banned Substance Compliance