Packet Errors
The Web Manager allows port error statistics compiled by the Switch's management agent to be viewed as either a line graph or a table. Four windows are offered.
Received (RX)
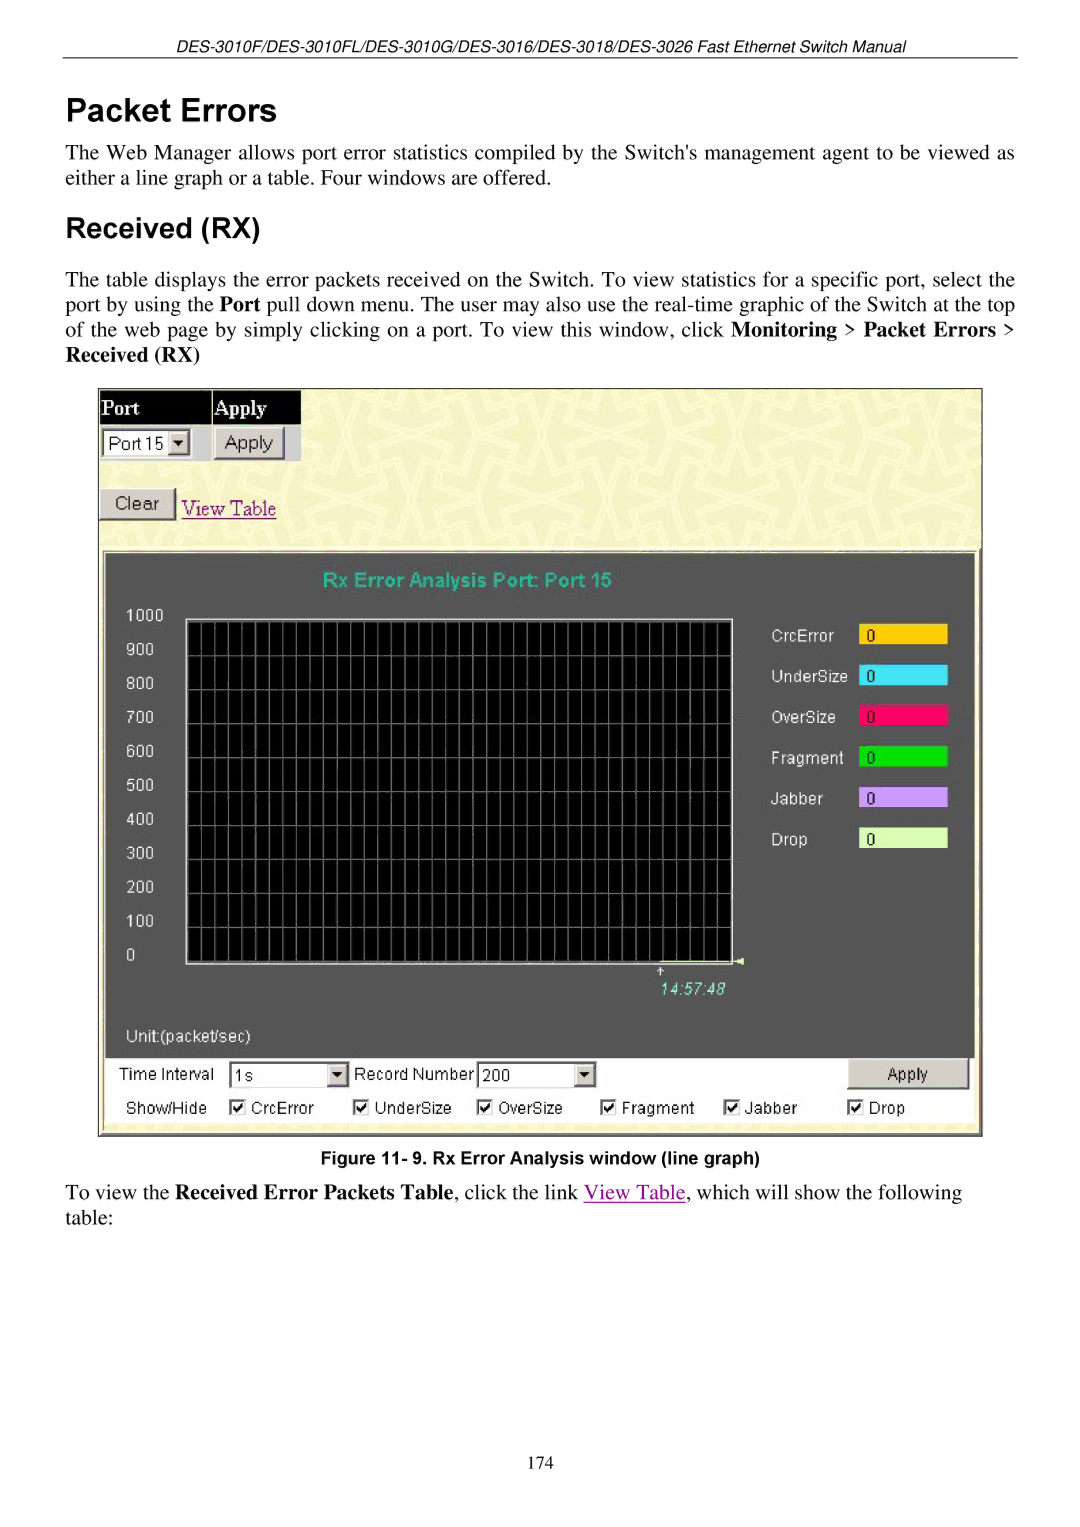
The table displays the error packets received on the Switch. To view statistics for a specific port, select the port by using the Port pull down menu. The user may also use the
Received (RX)
Figure 11- 9. Rx Error Analysis window (line graph)
To view the Received Error Packets Table, click the link View Table, which will show the following table:
174